Overview
Member Insights Lakehouse is built around the kind of internal data product a member-based health, fitness, or performance company would need: reliable event modeling, cohort analytics, experiment readouts, platform-health visibility, governed metric definitions, and natural-language analysis over trusted tables.
The project uses generated privacy-safe data. It does not use or imply access to private product, company, or member data. The goal is to show the architecture and product thinking: raw wearable and app signals become durable analytical tables that can support dashboards, experimentation, ML features, and governed AI workflows.
Live Product
The live app leads with operational product analytics, then lets stakeholders move into experimentation, platform health, metric definitions, and governed natural-language analysis without leaving the same product surface.
Architecture
This is the README architecture adapted directly into the portfolio case study. It shows the local implementation and the production migration path in one diagram: privacy-safe event sources, modeled analytical tables, product workflows, and the cloud-scale equivalents.
flowchart LR
subgraph Sources["Privacy-Safe Event Sources"]
A["Wearable telemetry\nheart rate, sleep, strain, recovery"]
B["App engagement\nsessions, workouts, check-ins"]
C["Member lifecycle\nplan, cohort, goal, status"]
D["Algorithm release assignments\nbaseline vs release candidate"]
end
subgraph Warehouse["Modeled Analytical Layer"]
E["stg_member_events\nimmutable event table"]
F["dim_members\nmember attributes"]
G["dim_experiment_assignments\nrelease groups"]
H["fct_member_day\none row per member per day"]
I["agg_cohort_daily\nperformance signal mart"]
J["agg_member_lifecycle\ngrowth and retention mart"]
K["agg_experiment_summary\nrelease outcome mart"]
L["metric_dictionary\ngoverned definitions"]
M["pipeline_run_log + model_inventory\nplatform observability"]
end
subgraph Product["Analytics Product Surface"]
N["Growth & Retention"]
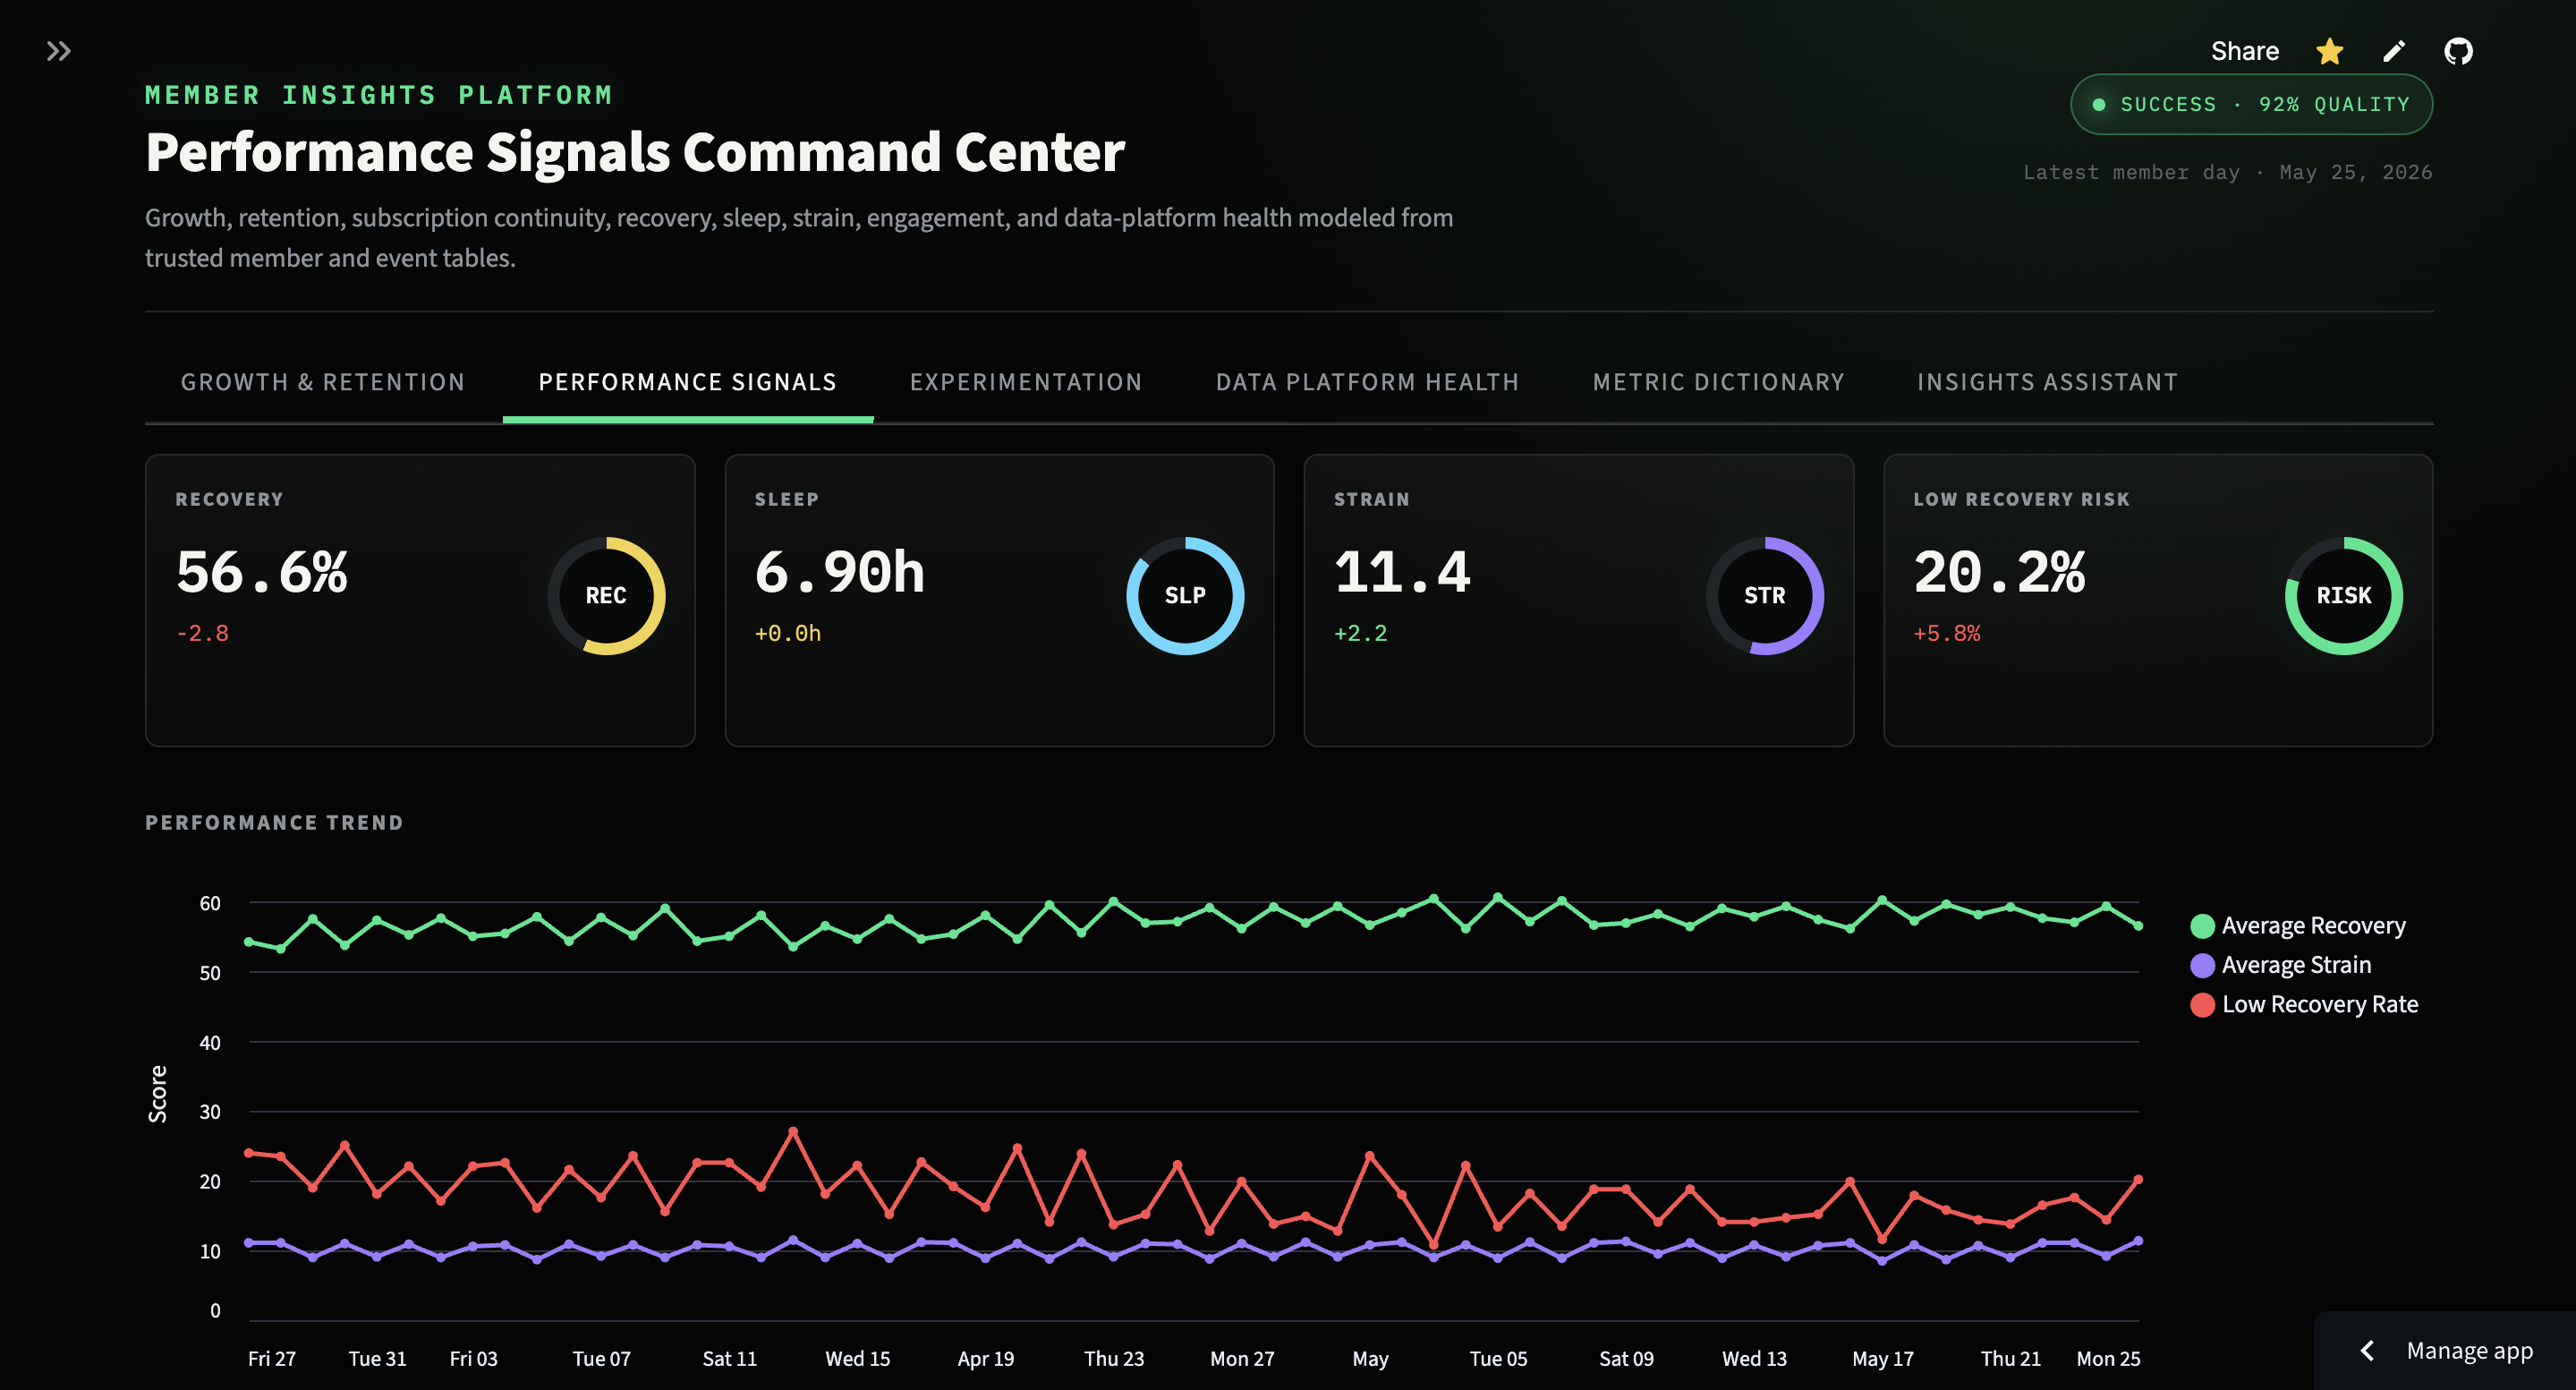
O["Performance Signals"]
P["Experimentation"]
Q["Data Platform Health"]
R["Metric Dictionary"]
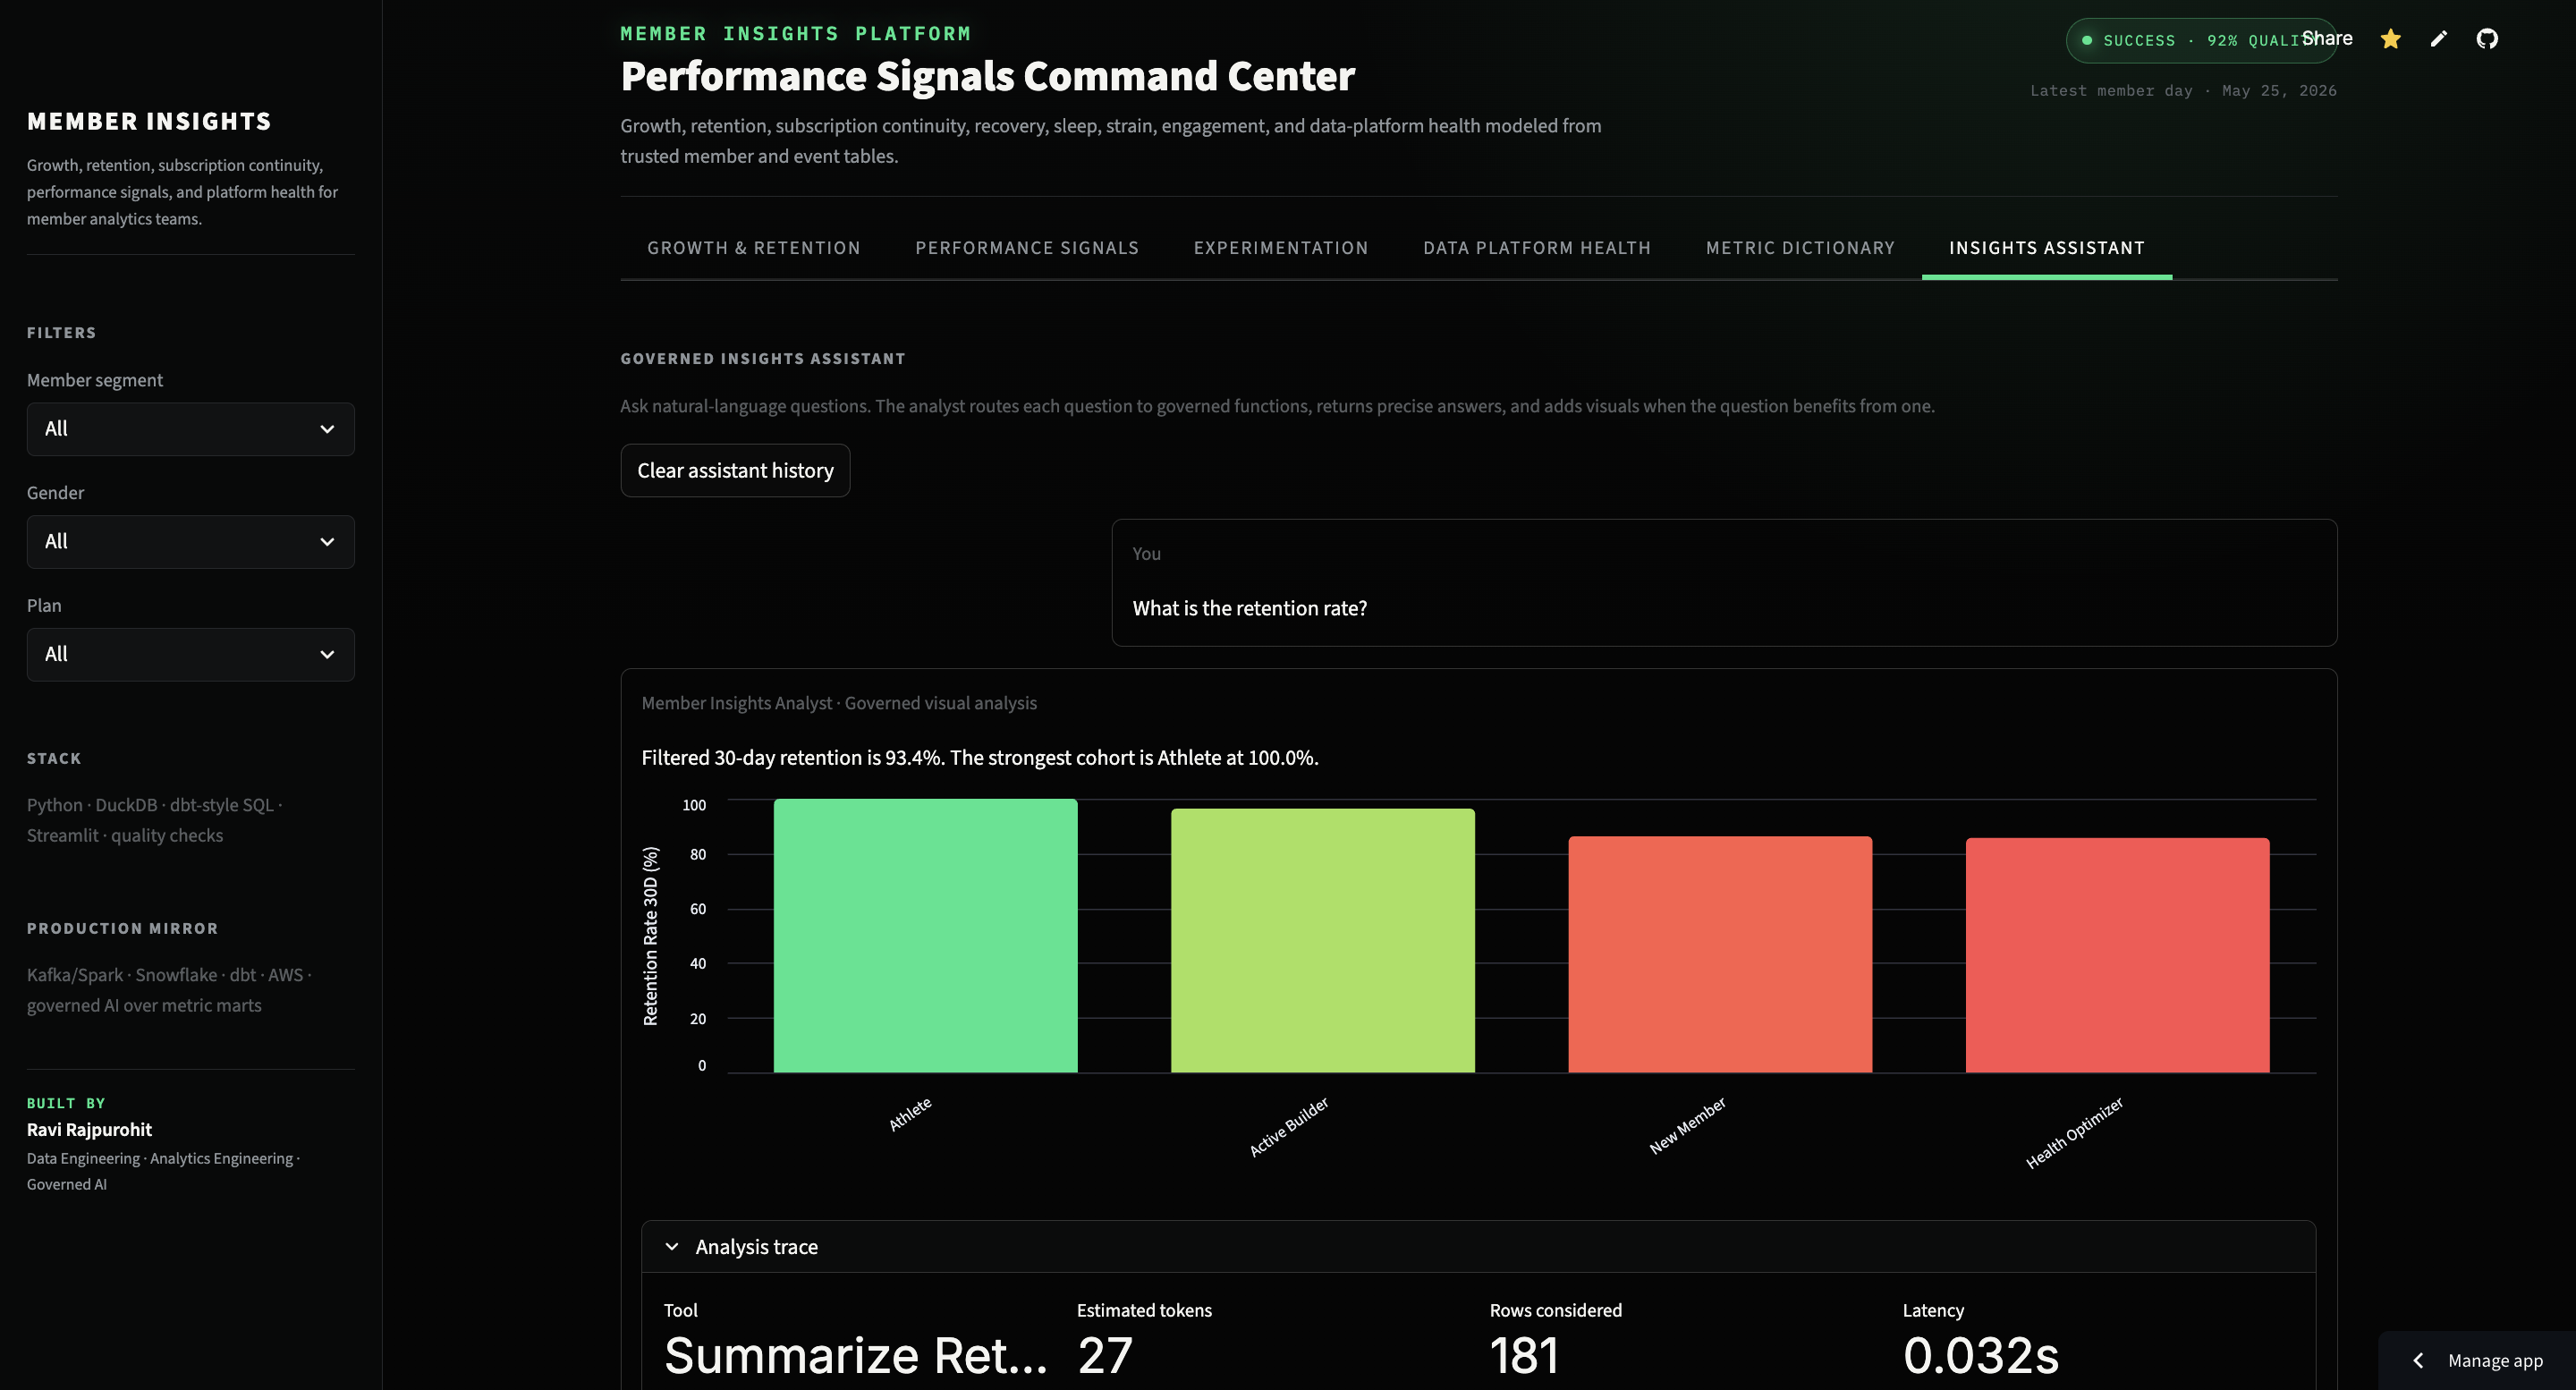
S["Insights Assistant\ngoverned visual analysis"]
end
subgraph Production["Production Direction"]
T["Kafka/Kinesis"]
U["Spark/PySpark"]
V["Snowflake + dbt"]
W["AWS observability"]
X["Approved AI tooling"]
end
A --> E
B --> E
C --> F
D --> G
E --> H
F --> H
G --> H
H --> I
F --> J
H --> K
I --> O
J --> N
K --> P
M --> Q
L --> R
I --> S
J --> S
K --> S
M --> S
L --> S
A -.production intake.-> T
H -.batch and streaming scale.-> U
H -.warehouse serving.-> V
Q -.monitoring and alerts.-> W
S -.approved AI layer.-> X Data Model
The central design choice is the member-day grain. It bridges immutable wearable/app events, member lifecycle attributes, experiment assignments, dashboard aggregates, and ML-ready feature tables. Cohort, lifecycle, and experiment marts then serve specific stakeholder questions without re-aggregating raw event streams inside the UI.
erDiagram
    DIM_MEMBERS {
        string member_id PK
        string cohort_month
        string plan_type
        string goal
        string status
        string acquisition_channel
    }
    STG_MEMBER_EVENTS {
        string event_id PK
        string member_id FK
        timestamp event_ts
        string event_type
        number recovery_score
        number sleep_hours
        number strain_score
        number heart_rate
    }
    DIM_EXPERIMENT_ASSIGNMENTS {
        string member_id FK
        string experiment_name
        string variant
        date assigned_date
    }
    FCT_MEMBER_DAY {
        string member_id FK
        date metric_date
        number recovery_score
        number sleep_hours
        number strain_score
        number engagement_score
        boolean low_recovery_flag
    }
    AGG_COHORT_DAILY {
        string cohort_month
        date metric_date
        number active_members
        number avg_recovery
        number avg_sleep
        number avg_strain
    }
    AGG_MEMBER_LIFECYCLE {
        string segment
        number new_members
        number active_members
        number retention_30d
        number subscription_continuity
    }
    AGG_EXPERIMENT_SUMMARY {
        string experiment_name
        string variant
        number recovery_lift
        number sleep_lift
        number engagement_lift
        number low_recovery_guardrail
    }
    DIM_MEMBERS ||--o{ STG_MEMBER_EVENTS : "generates"
    DIM_MEMBERS ||--o{ FCT_MEMBER_DAY : "summarized_as"
    STG_MEMBER_EVENTS ||--o{ FCT_MEMBER_DAY : "modeled_into"
    DIM_EXPERIMENT_ASSIGNMENTS ||--o{ FCT_MEMBER_DAY : "annotates"
    FCT_MEMBER_DAY ||--o{ AGG_COHORT_DAILY : "aggregates"
    DIM_MEMBERS ||--o{ AGG_MEMBER_LIFECYCLE : "segments"
    FCT_MEMBER_DAY ||--o{ AGG_EXPERIMENT_SUMMARY : "rolls_up"
Delivery Progression
The project was built in progressive layers: first the analytical contract and quality gates, then the stakeholder workflows, then the governed assistant and public-ready presentation. That framing is more useful than a chronological task log because it shows how the prototype matured toward a production-grade data product.
timeline
    title Member Insights Lakehouse Development Lifecycle
    2026-05-24 : Defined the member-insights data product
               : Identified growth, retention, recovery, sleep, strain, engagement, and experiment questions
               : Generated privacy-safe member, wearable, app, lifecycle, and release-assignment data
               : Built the DuckDB warehouse, SQL model layer, quality checks, and first Streamlit surface
    2026-05-25 : Matured the app into a governed analytics surface
               : Added Growth, Performance, Experimentation, Platform Health, Dictionary, and Assistant workflows
               : Replaced open-ended LLM dependency with a governed function router and visual responses
               : Refactored reusable data access, metric logic, and UI patterns into dedicated modules
    2026-05-27 : Prepared the project for public portfolio review
               : Audited public wording, repository hygiene, theme configuration, and live-app presentation
               : Refined architecture, production mapping, screenshots, and case-study narrative
Key Engineering Decisions
Why model member-day facts before building aggregates?
Member-day is the useful bridge between raw events and downstream analytics. It can support recovery, sleep, strain, engagement, risk flags, cohort trends, experimentation, and ML feature work without forcing each consumer to understand raw event semantics. That extra modeling step creates a stable contract for the rest of the product.
Why make reliability visible inside the dashboard?
Metric trust depends on freshness, model inventory, quality gates, and table grain. Hiding those checks in terminal output would make the app look more polished but less production-minded. The Data Platform Health workflow exposes run status, modeled table counts, freshness, and quality pass rate alongside the business metrics that depend on them.
Why describe release groups as baseline and release candidate?
Control and treatment are statistically precise, but baseline and release candidate are easier for product and engineering stakeholders to scan during an algorithm-release review. The model still captures experiment assignments and lift metrics, while the UI uses language that matches how teams discuss rollout decisions.
Why use function routing instead of open-ended SQL generation?
The assistant is designed as a governed visual analyst. It routes natural-language prompts to curated analytical functions, answers from modeled aggregate tables and metric definitions, attaches charts when useful, and shows trace metadata including selected tool, estimated tokens, rows considered, latency, API calls, and API cost. This avoids hallucinated definitions and keeps AI behavior inside approved analytical boundaries.
Outcome & Reflection
This project demonstrates how a compact app can still carry production-grade data habits: explicit grains, quality checks, observability, metric governance, experiment support, and natural-language access over trusted data products. The strongest walkthrough path is to show growth and retention first, then experimentation, then platform health, then the assistant trace.
In production, generated CSVs would become Kafka or Kinesis event streams, DuckDB would become Snowflake, the SQL build would become a dbt DAG with CI, Python checks would become dbt tests or Great Expectations, and the governed function router would become an approved AI workflow with access controls, evaluation traces, and audit logs.