Ravi Rajpurohit
About
Building data systems
that actually get used.
I've spent the last several years building pipelines that process billions of events per month, cloud data platforms that cut executive reporting from days to under an hour, and data visualizations that make complex datasets worth looking at.
Before my MS in Computer Science at UT Arlington, I built the data backbone for a wearable health platform at KaHa Technologies — Kafka ingestion, real-time telemetry, 10M+ users. I'm most interested in the full picture: from how data gets ingested to whether the person reading the dashboard actually trusts what it shows.
⚡ Outside of work: 🏸 racket sports, 🎸 music, 🧑🍳 cooking — and yes, I once worked as a chef for my university.

2B+
events/month processed
10M+
users served
5M+
records/day through current pipelines
Capabilities
What I Build
End-to-End Data Pipelines
Kafka ingestion at 2B+ events/month, Python and PySpark transformations, dbt modeling, dimensional schemas — the whole chain from raw source to analytics-ready table.
Cloud Data Platforms
AWS (Glue, Athena, Spark, S3), Snowflake, Databricks, DuckDB. I care about what each tool actually costs and whether engineers will be able to maintain it six months later.
Analytics & BI
Executive dashboards, D3.js data stories, self-serve reporting. I think about who is going to open this dashboard at 8am and what they actually need to see — not just what the data model can technically produce.
ML-Enabling Infrastructure
Feature pipelines and data layers for real-time ML inference — health wearable telemetry at 10M+ user scale, high-frequency biosensor research at 200Hz. The ML model is only as good as the data it gets.
Experience
Where I've Worked
Data Infrastructure Engineer
State of Michigan — Ottawa Area ISD
- Built an AWS data lake consolidating 15+ siloed data sources — cut executive report generation from 3 days to under 1 hour.
- Designed ELT pipelines in Python and PySpark processing 5M+ daily records; provisioned the full stack as a serverless, event-driven architecture using AWS CloudFormation.
- Built AWS Step Functions state machines with explicit failure branches, per-run DynamoDB audit logging, and SNS alerting — ensuring every pipeline failure surfaces immediately rather than silently propagating to downstream dashboards.
- Deployed semantic-layer dashboards across Tableau, Power BI, and QuickSight — abstracting dimensional model complexity so business teams could self-serve answers without analyst intervention.
- Accelerated team productivity by 20% by integrating AI coding assistants into documentation and development workflows.
Software Data Engineer — Wearables & MLOps
KaHa Technologies
- Built a real-time telemetry pipeline on Apache Kafka processing 2B+ monthly events from 10M+ wearable users with end-to-end lag under 5 seconds.
- Designed a multi-store data layer (DynamoDB, S3, Redshift) matched to each access pattern — from low-latency device reads to batch ML training and warehouse analytics.
- Built observability and data quality monitoring pipelines with Prometheus, catching bad data upstream of data science workflows and accelerating model iteration speed by 25%.
- Built A/B testing infrastructure and self-serve analytics that enabled product teams to independently design, run, and evaluate experiments — removing the data team as a bottleneck on product iteration.
- Instrumented mobile apps with Firebase analytics and built a BigQuery pipeline that auto-segmented performance by device make, model, and OS version — replacing ad-hoc QA queries with an automated daily report.
Data Engineer Intern — Cloud & APIs
Nutanix
- Integrated the internal analytics platform into Nutanix's IAM via JWT, eliminating duplicate credentials and driving daily adoption gains; delivered the GoLang API on Kubernetes via Jenkins CI/CD.
- Served as the bridge between engineering and analytics to define source-to-target data contracts; delivered role-based dashboards for Support and Sales from 500GB+ of daily product telemetry.
- Awarded 2nd place in the company-wide hackathon for prototyping a product recommendation module powered by customer usage signals.
Data Engineer — Research Applications
University of Texas at Arlington
- Built a high-frequency wearable sensor data pipeline — ingesting raw device readings, applying noise filtering, and extracting structured features — delivering ML-ready datasets for multiple concurrent research experiments.
- Orchestrated ETL workflows with Apache Airflow, reducing processing latency by 35%.
- Implemented automated data quality tests with dbt and daily job execution monitoring, catching upstream data issues before they could corrupt ML feature extraction or degrade model results.
Education
MS Computer Science
University of Texas at Arlington
Also while there
Projects
Featured Work
Projects with a Case Study include architecture diagrams, data models, and the key engineering decisions behind them.
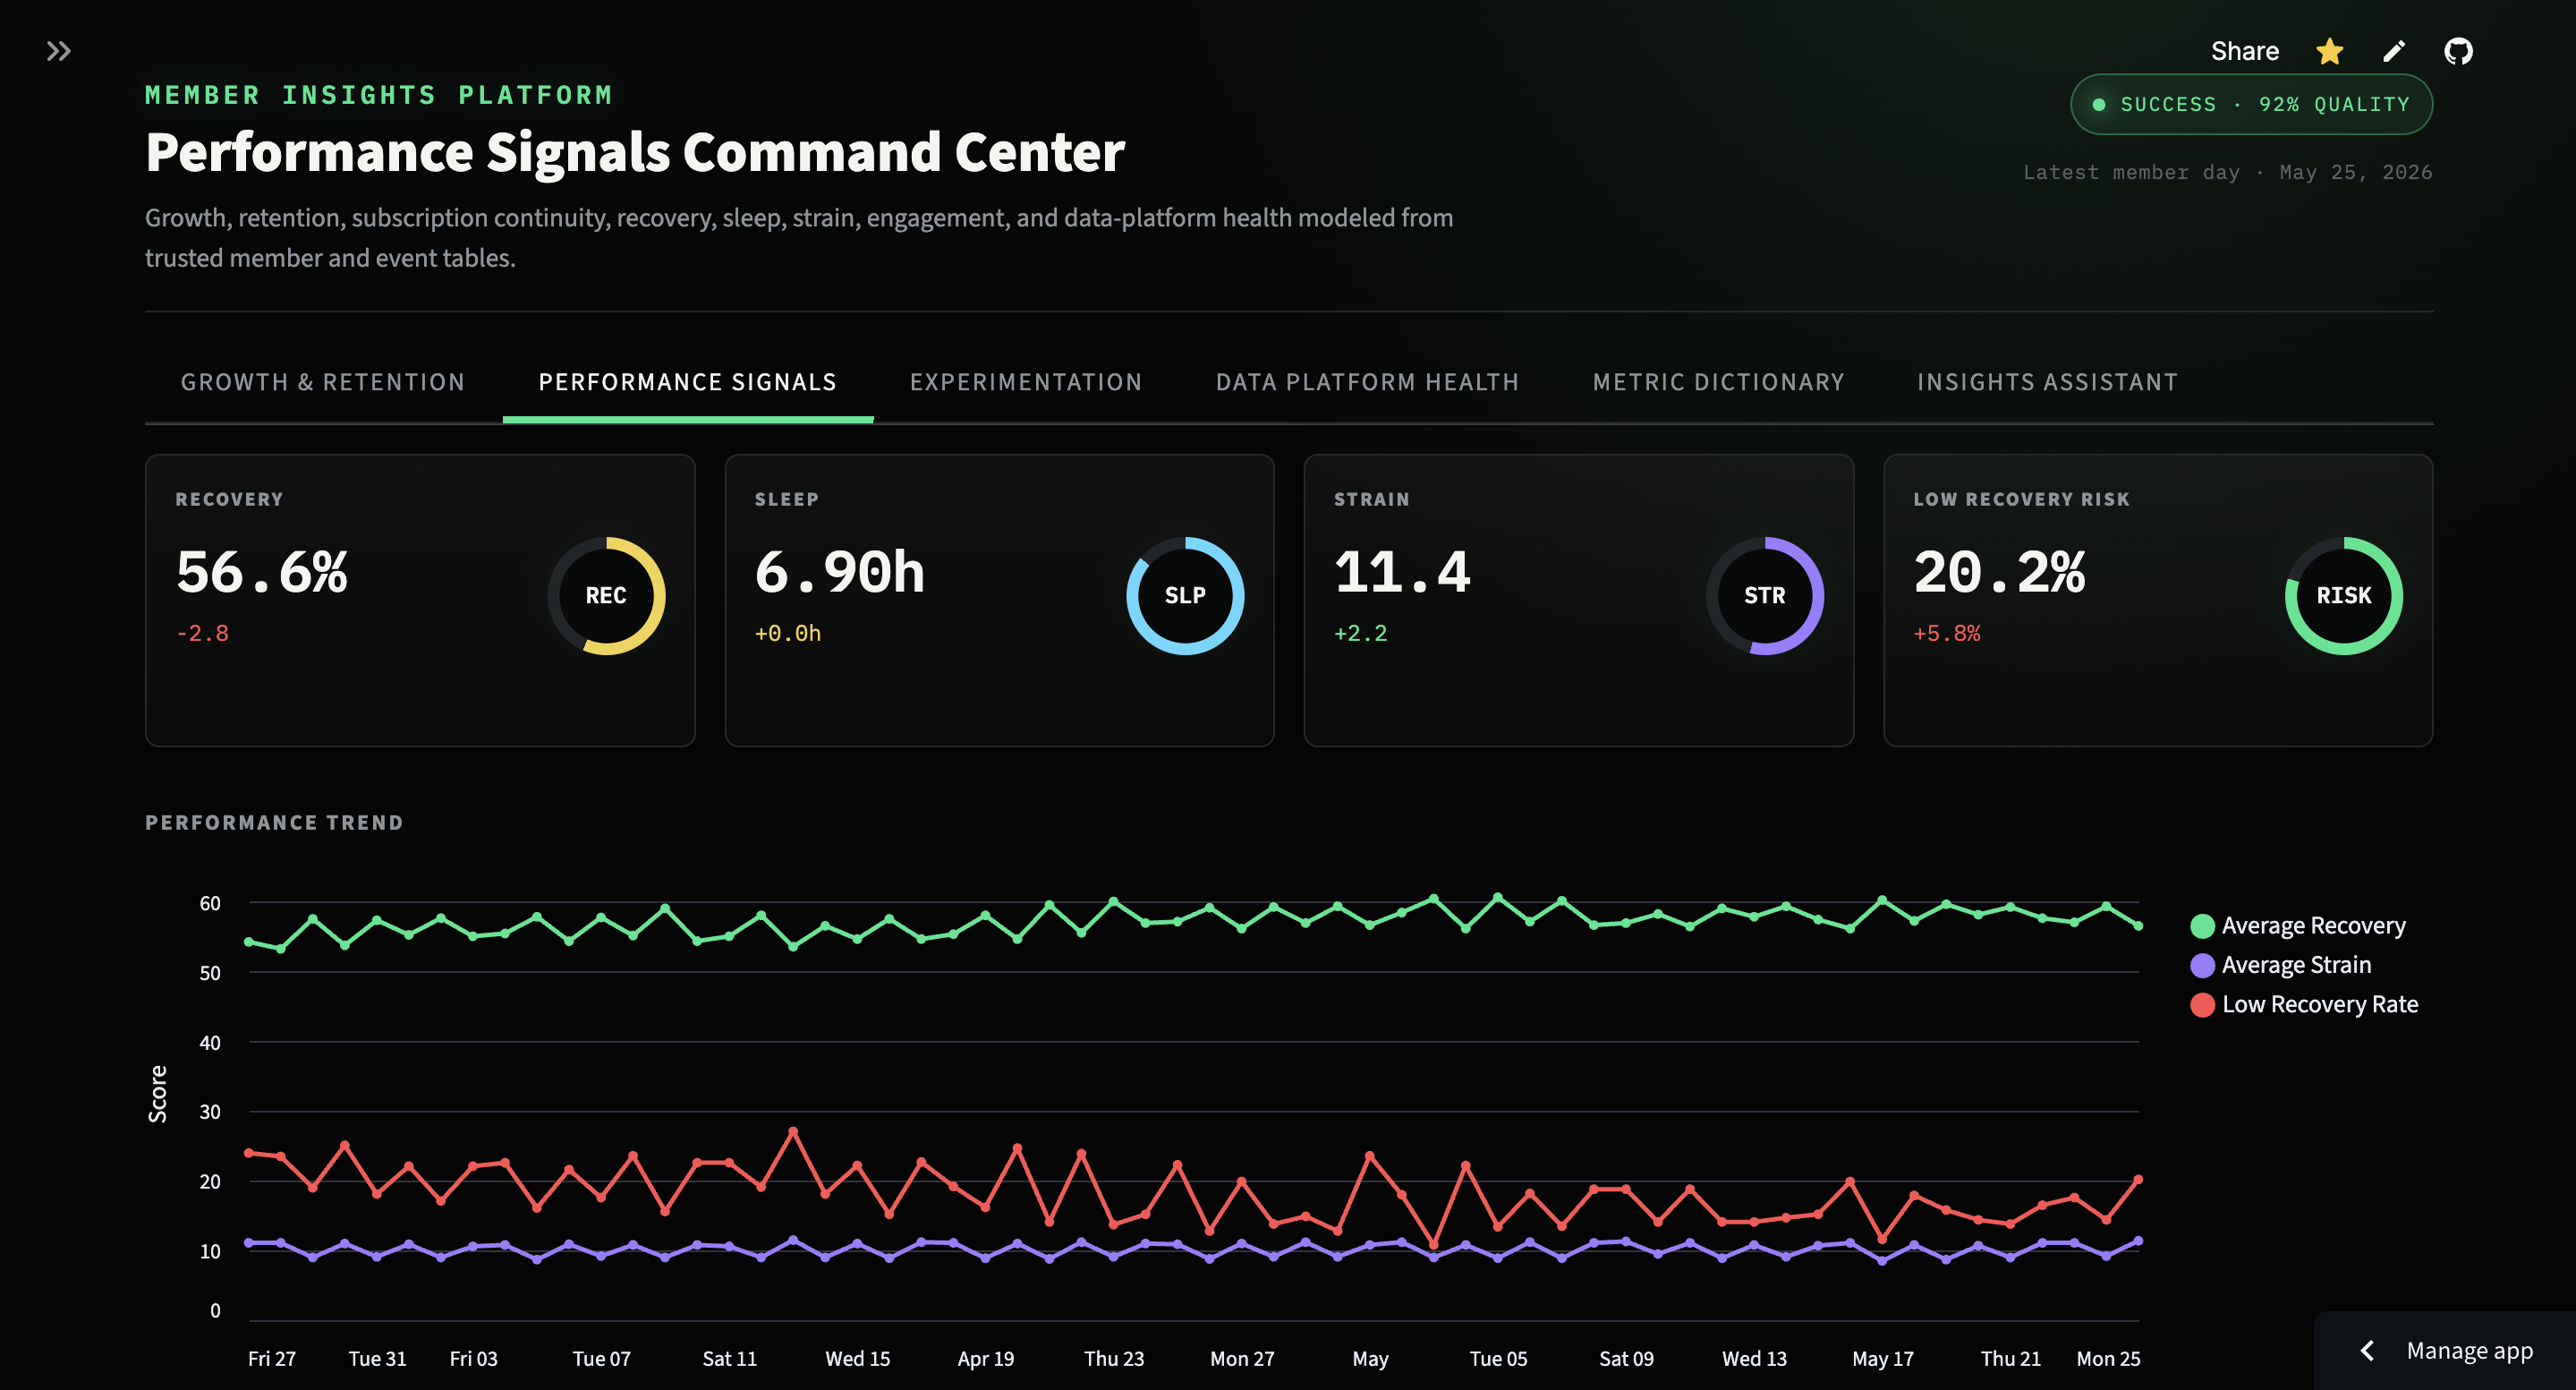
Member Insights Lakehouse
Wearable Analytics & Governed AI Insights
A member-insights analytics application that models privacy-safe wearable, app, lifecycle, and experiment events into trusted member-day facts, cohort marts, experiment summaries, platform-health checks, metric definitions, and governed natural-language analysis.
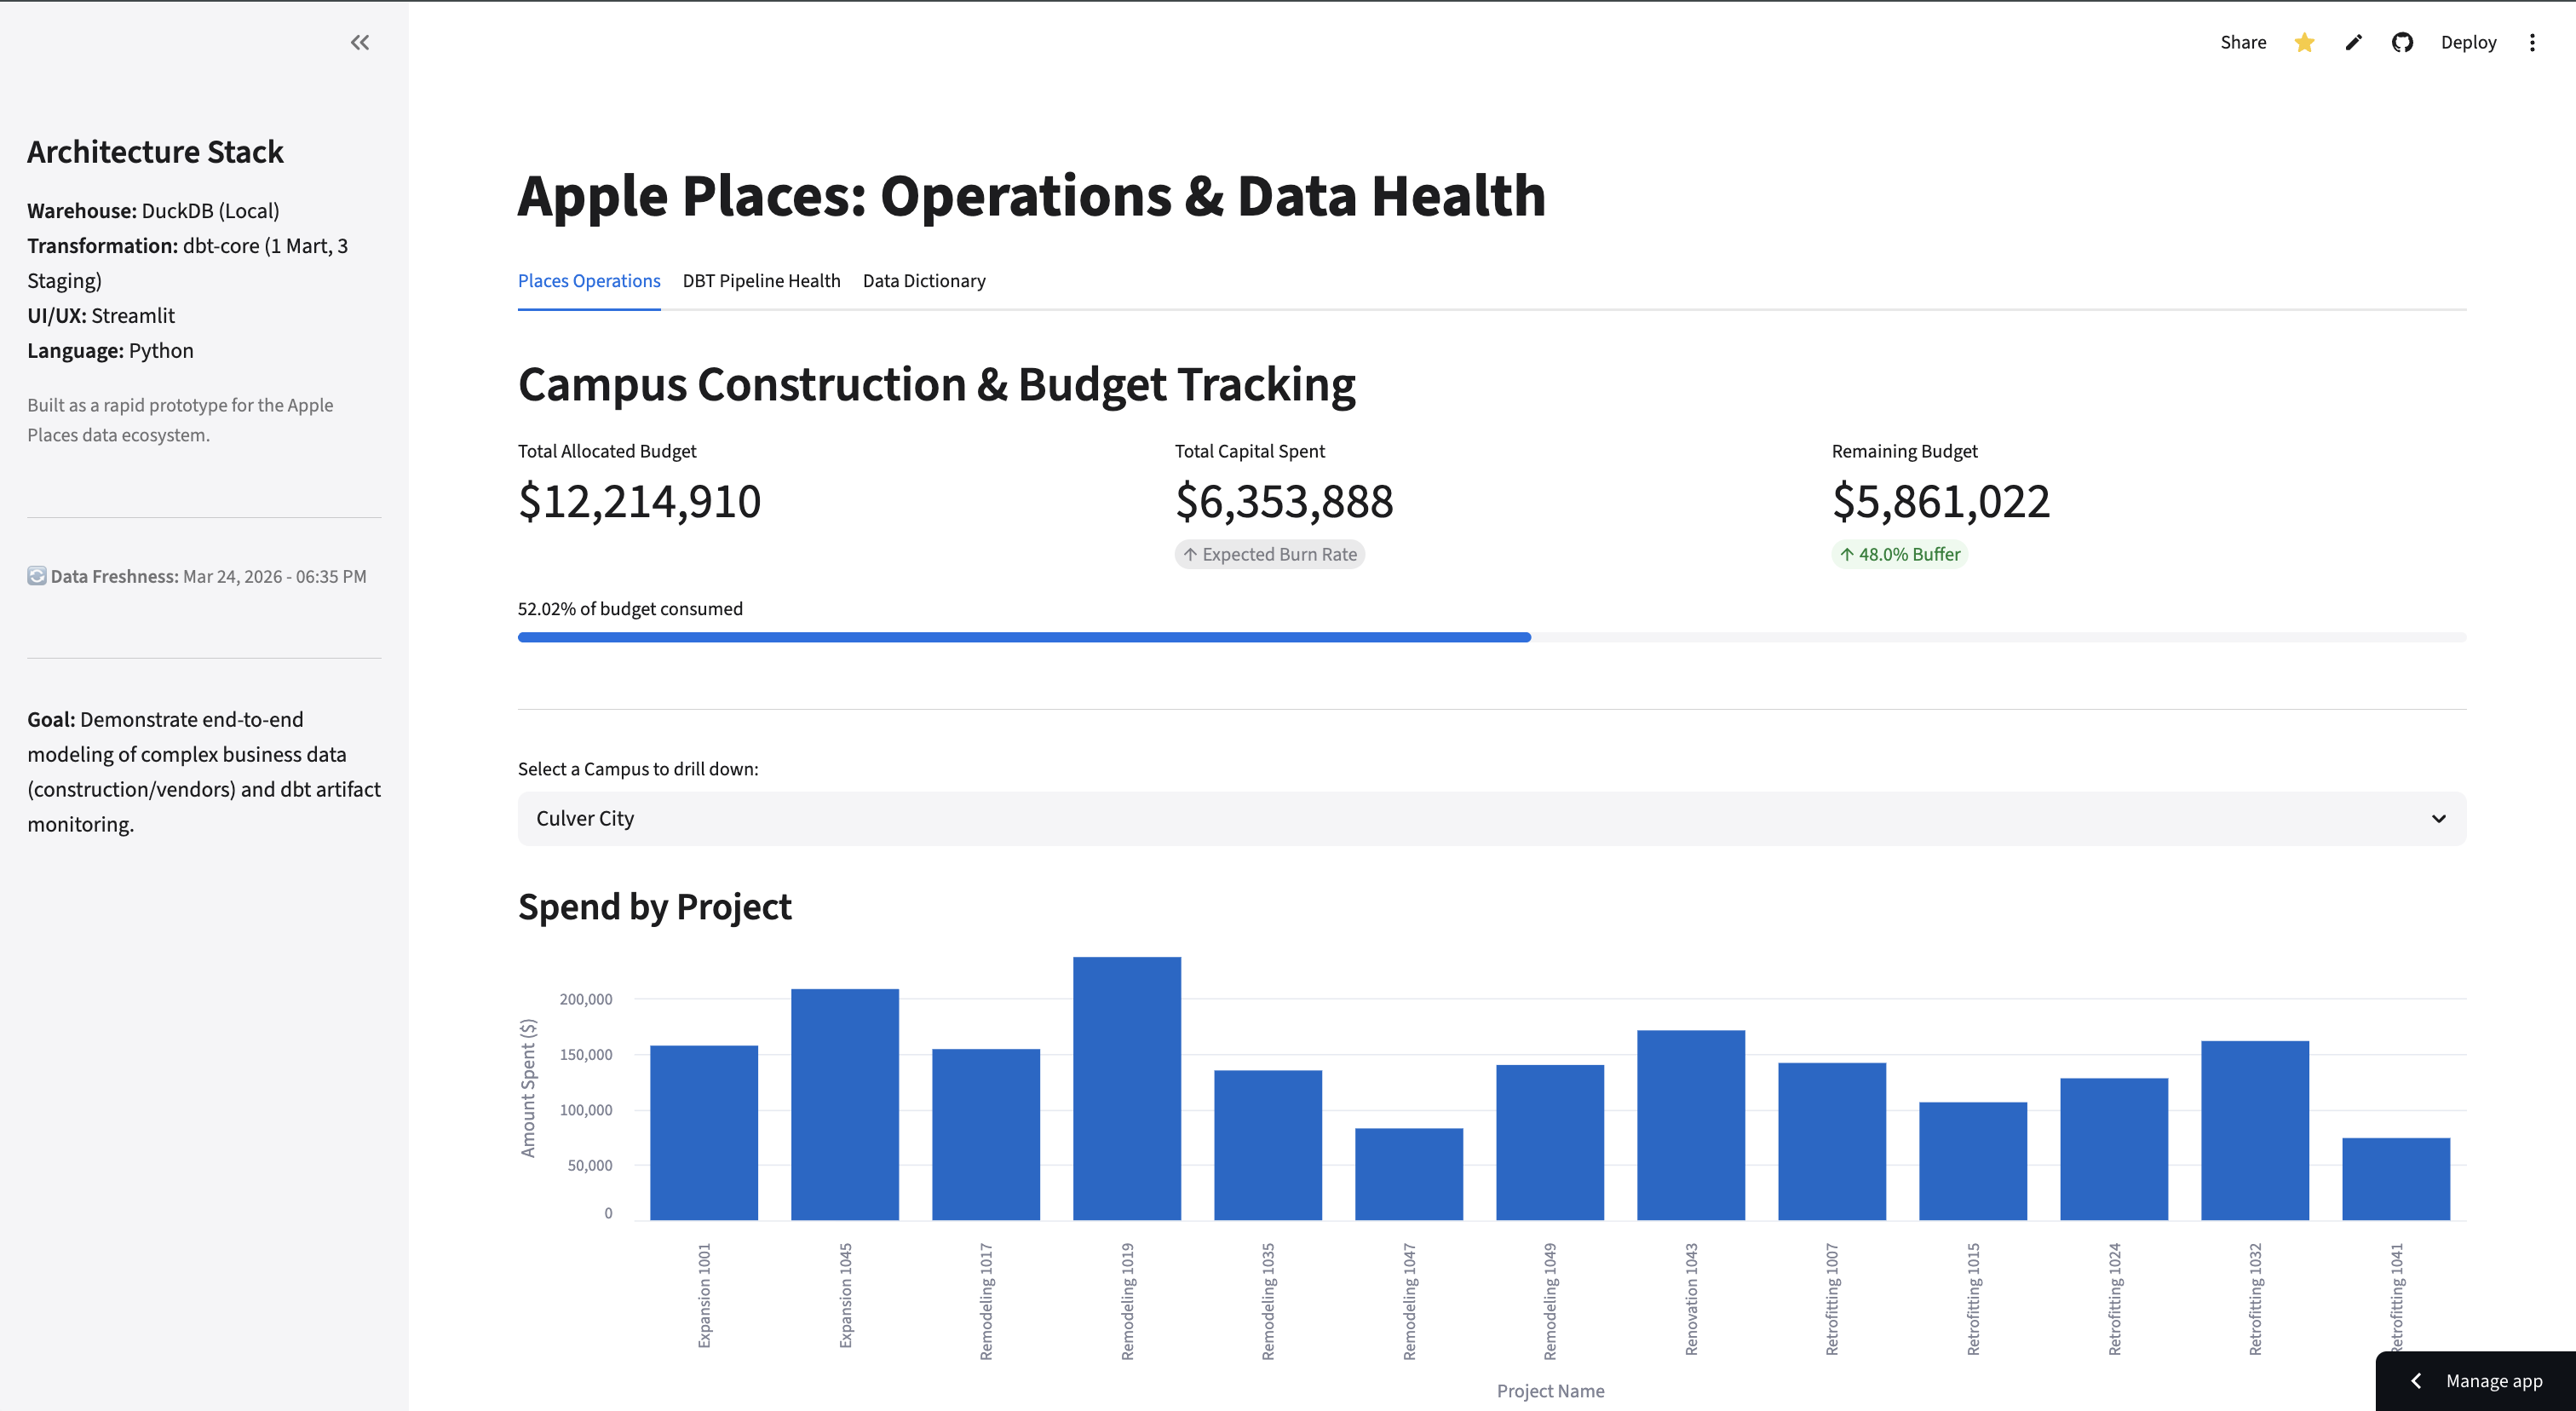
PlacesOps
Construction & Corporate Analytics Command Center
A production-minded analytics hub for construction, vendor, budget, and expense data. Five Streamlit workflows combine executive operations, cost and vendor risk, dbt platform health, metric documentation, and governed AI-assisted insights over a trusted DuckDB/dbt spend mart.
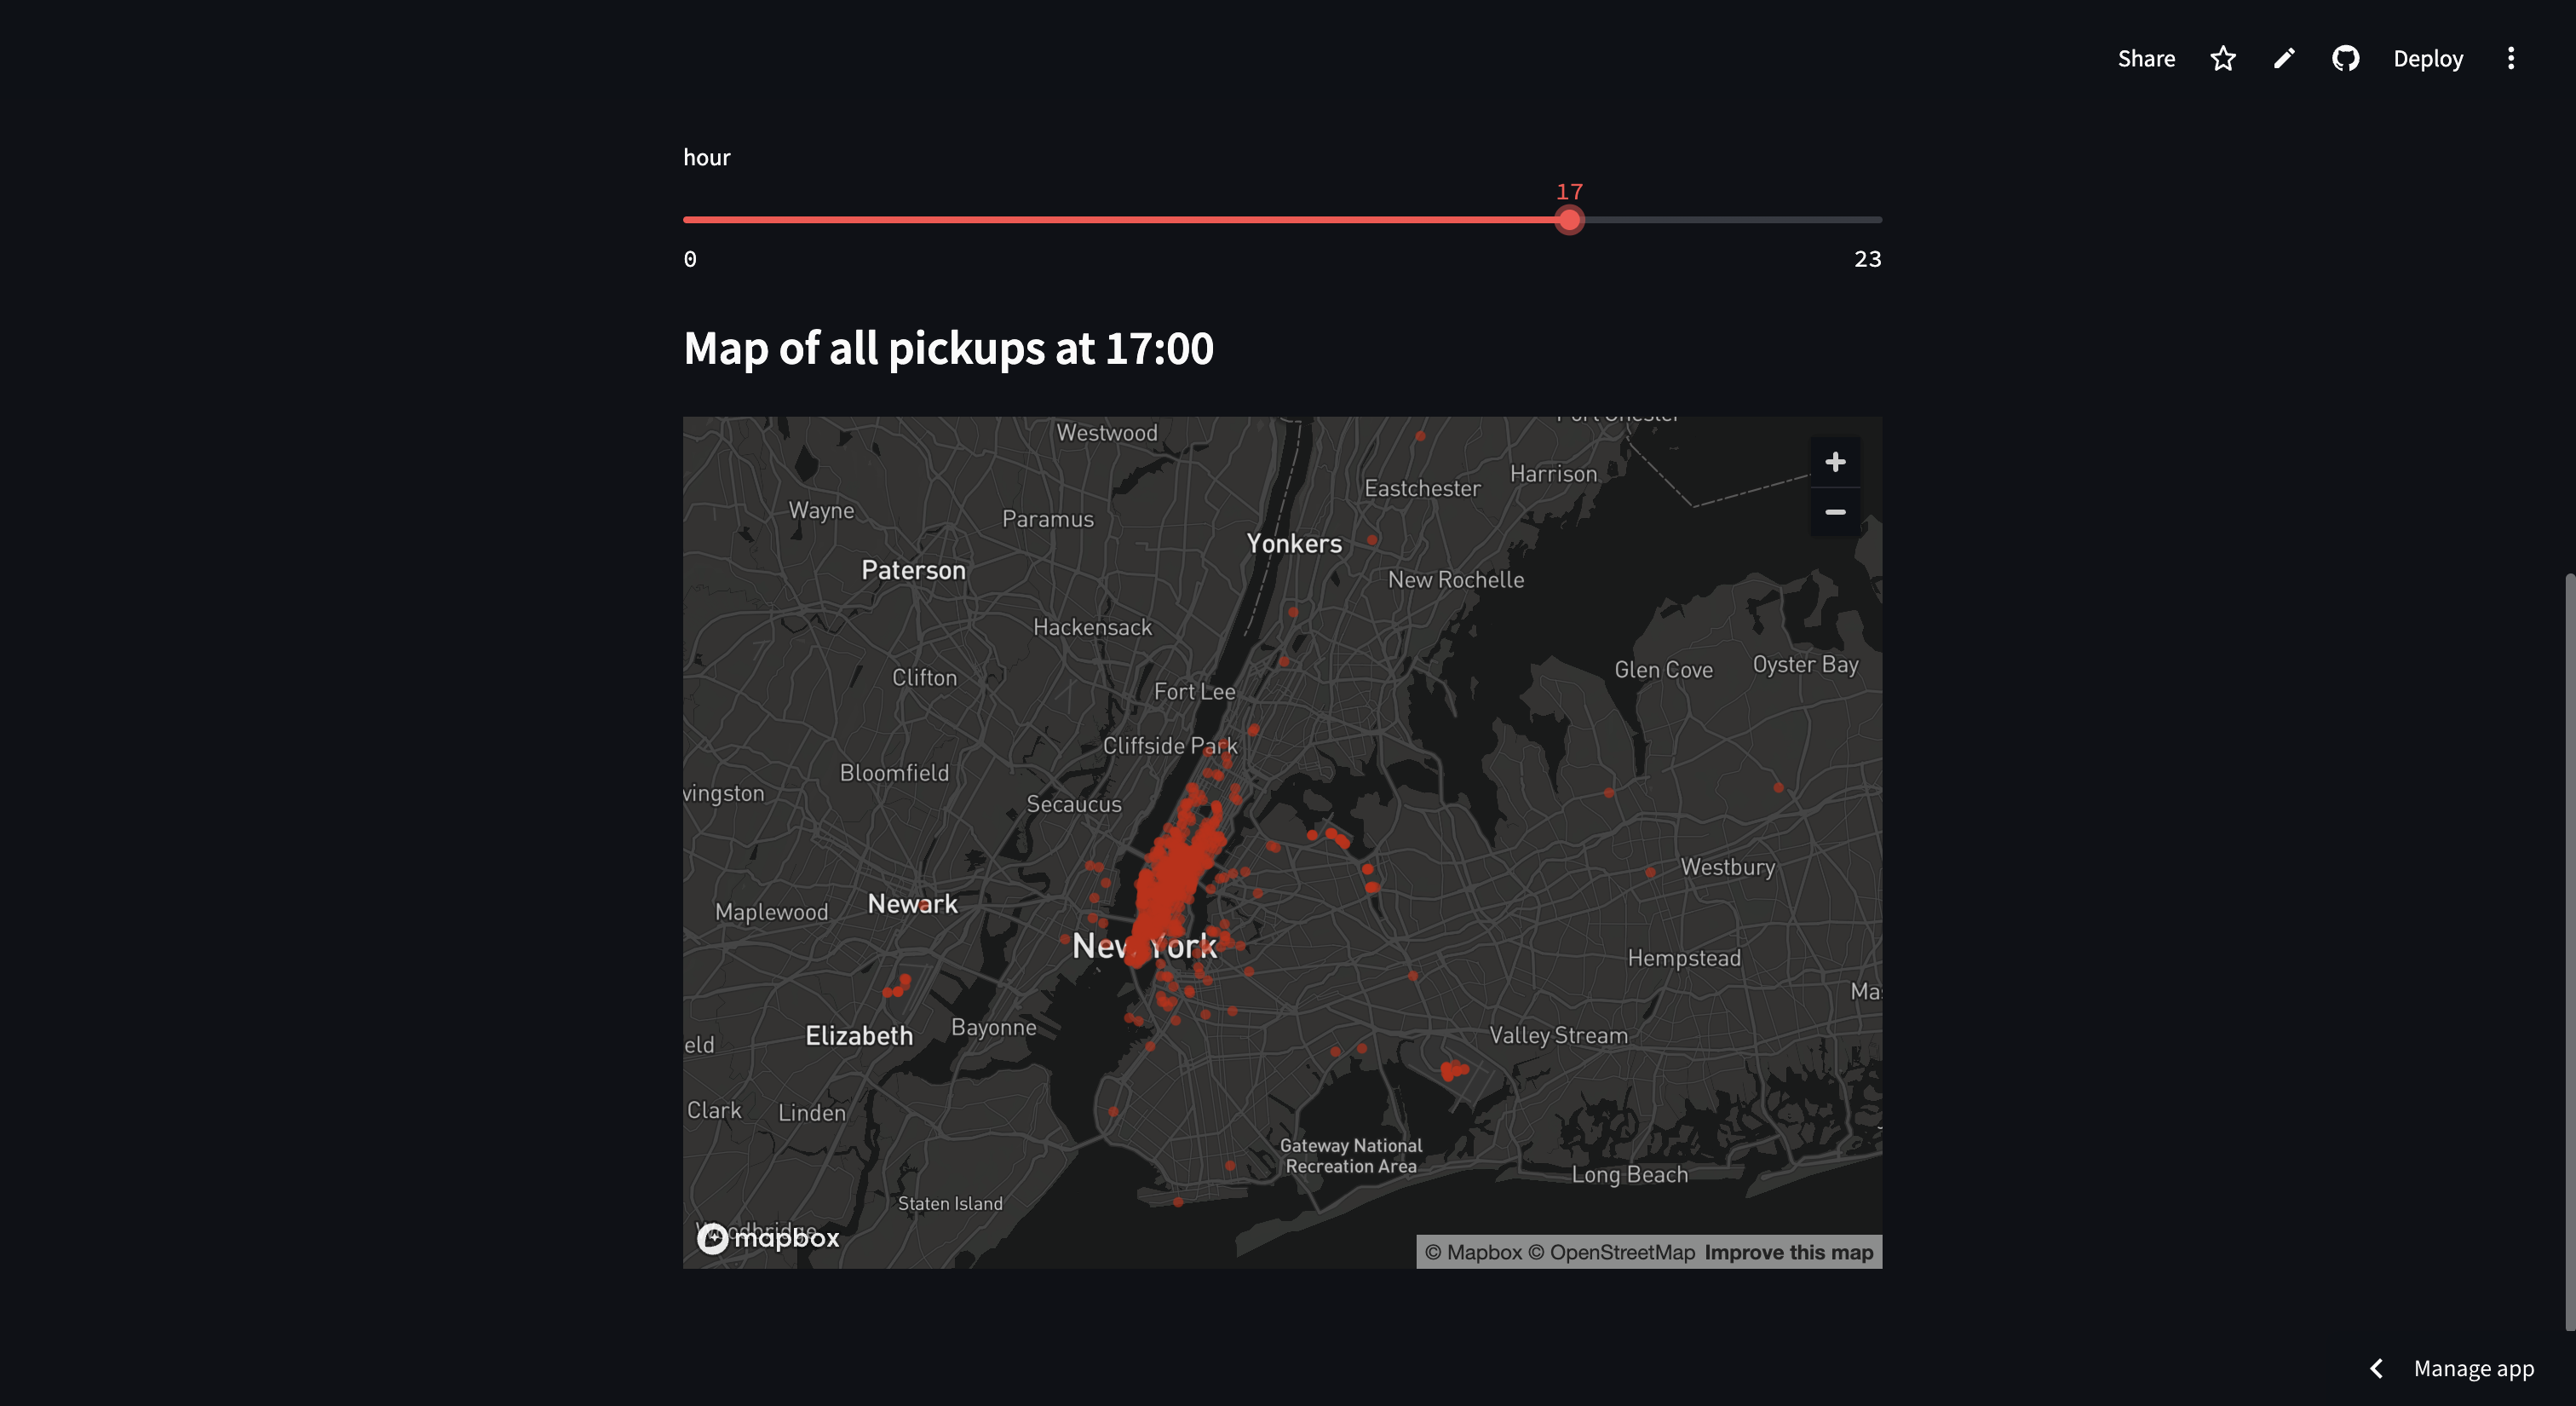
Uber NYC Dashboard
Multi-Page Data & AI Analytics App
Rebuilt from a Streamlit tutorial into a multi-page data and AI engineering app. Three pages — Home (KPIs and anomaly detection), Map Explorer (Pydeck geospatial layers), and AI Analyst (LLM chat with function calling) — all powered by a structured ingest → enrich → aggregate pipeline on ~1M NYC Uber records. Provider-agnostic: runs on local Ollama or Groq cloud with no code changes.

Learner Activity Pipeline
Medallion ELT Architecture Redesign
Diagnosed four critical anti-patterns in a Matillion + Snowflake ETL pipeline and rebuilt it as a robust, idempotent Medallion ELT architecture with S3 staging, high-water mark incremental loads, and MERGE-based upserts.
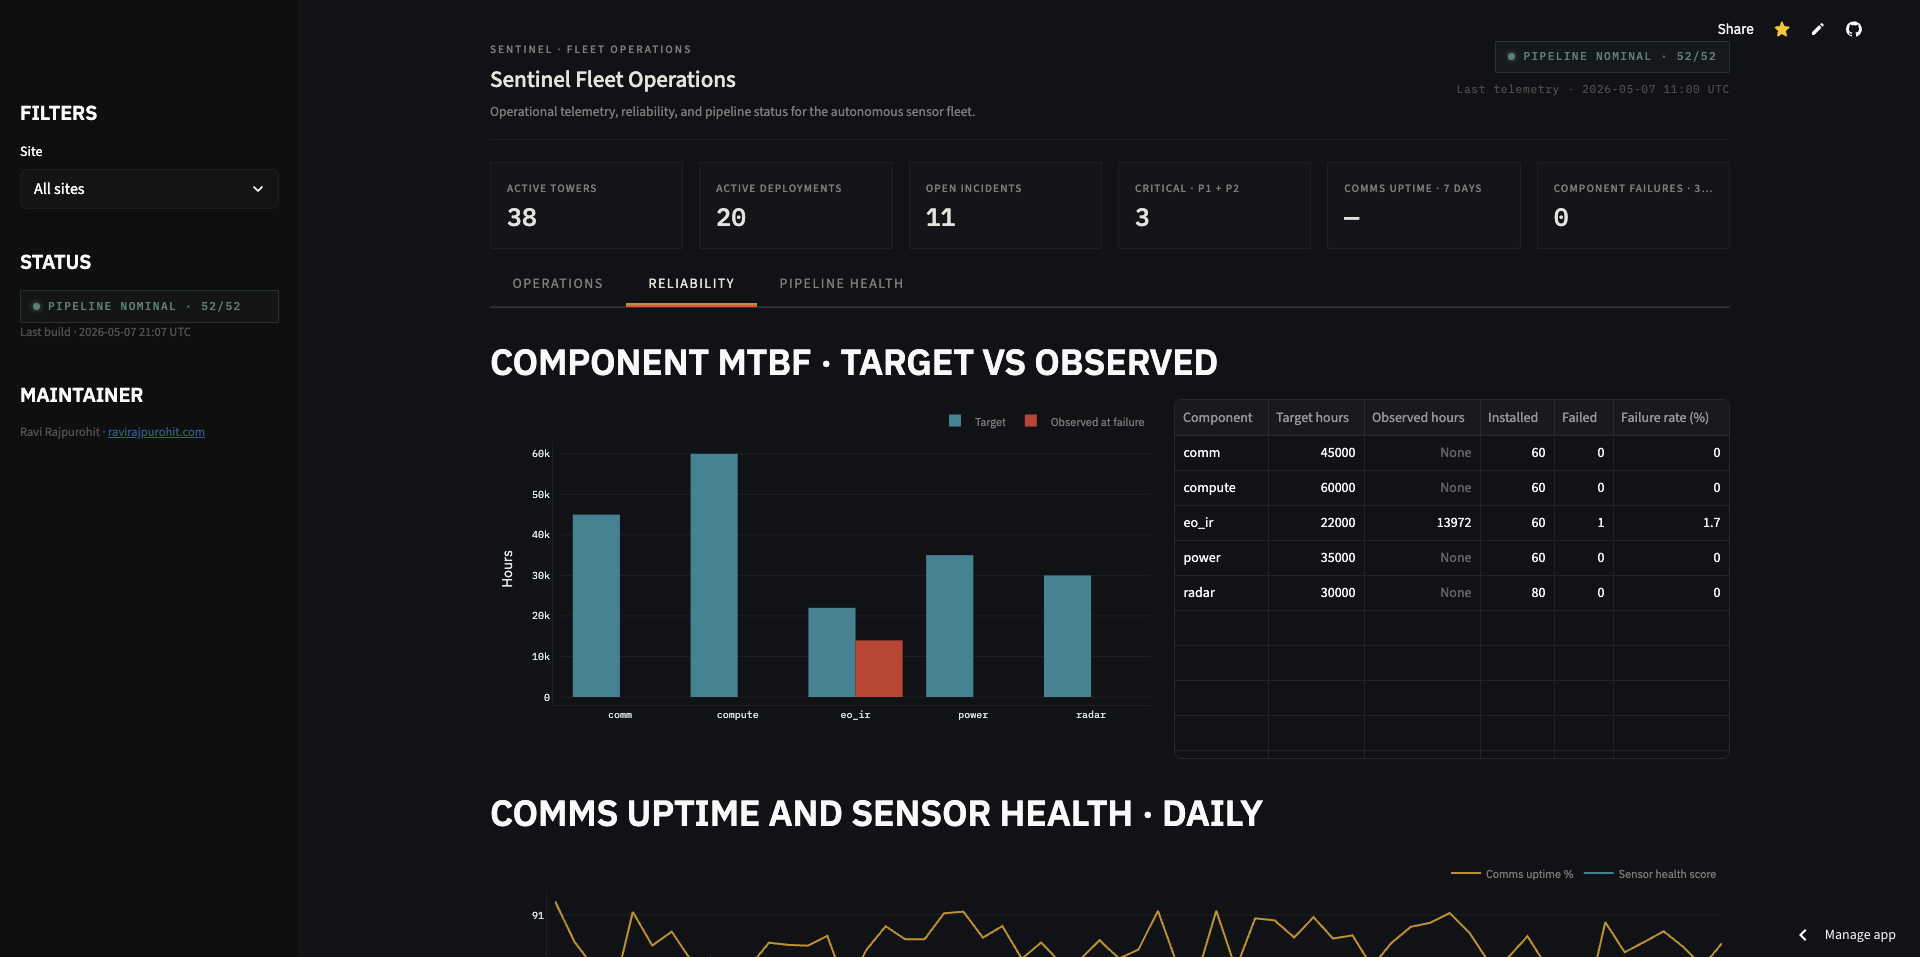
Sentinel Fleet Operations
Sentry Domain Mission Analytics Platform
A mission analytics platform for an autonomous surveillance fleet, built on DuckDB, dbt, and Streamlit. Four tabs — Operations, Detection Analytics, Reliability, and Pipeline Health — serve commanders, analysts, engineers, and data teams from a single star-schema fact layer. 66 dbt tests, 9 sources, 8 mart models, and a pre-built DuckDB artifact shipped with the repo.

App Store Ecosystem Analytics
Interactive Data Storytelling with D3.js
500MB of raw Kaggle data, pre-aggregated down to 50KB via Python, rendered as a smooth animated bar chart race in D3.js. 13 years of App Store genre competition in one visualization. Published on Medium.
Toolkit
My Toolkit
Tools I reach for — and know well enough to have opinions about.
Data Engineering & Orchestration
Cloud & Data Platforms
Databases & Storage
Visualization & Analytics
Infrastructure & DevOps
Writing
Technical Writing
I write about data engineering patterns, visualization architecture, and lessons from building real systems.
Designing a Scalable Learner Data Pipeline: A Medallion Architecture Approach
A deep-dive into diagnosing four critical anti-patterns in a Matillion + Snowflake ETL design — memory exhaustion, brittle truncate-and-load, slow row-by-row inserts, and hardcoded credentials — and redesigning the pipeline into a robust, idempotent ELT architecture using S3 staging, high-water mark incremental loads, and MERGE-based upserts.
The "Genre Wars": How I Visualized 13 Years of App Store History (Without Crashing Your Browser)
A Data Engineer's guide to turning 500MB of raw logs into a silky-smooth 50KB data story using Python and D3.js. Covers pre-aggregation strategy, D3.js animation architecture, and performance optimization.
Exploring the Relationship Between PPG Data and Heart Rate Variability
An investigation into PPG-based HRV tracking for stress and recovery monitoring. Covers signal processing, data pipeline design for biosensor streams, and insights from real wearable data.