Context
Ottawa Area ISD is a regional educational service agency serving K-12 school districts across West Michigan. The data problem was straightforward but deep: student enrollment, financial, and assessment data lived in 15+ separate systems — CEPI, MSDS, MISCHOOL, TSDL, and district-level SIS platforms (Power School, Synergy, Infinite Campus) — with no unified layer. Every executive report required an analyst to manually pull, reconcile, and join data across systems. That process took three days per report.
The goal was to design and build a data lake on AWS that could consolidate all of these sources into a single queryable layer, with proper governance, orchestration, and monitoring built in from the start.
Before and After
The change in report generation time was the most concrete outcome, but the underlying shift was architectural.
Before
flowchart LR
    A["15+ siloed sources\nCEPI · MSDS · MISCHOOL\nDistrict SIS platforms"] -->|"manual export\nper request"| B["Analyst\nruns query"]
    B -->|"3 days"| C["Executive\nreport"]
After
flowchart LR
    A["Unified Data Lake\nAll sources consolidated\nPartitioned Parquet"] -->|"Athena SQL"| B["QuickSight / Power BI\ndashboard"]
    B -->|"under 1 hour"| C["Executive\nreport"]
    style A fill:#2997ff,color:#fff,stroke:#0077ed
System Architecture
Data flows from heterogeneous state and district sources through a three-layer medallion architecture (raw → stage → analytics) — governed by Lake Formation and queryable via Athena. The layers diagram below shows how each AWS service maps to a functional responsibility; the data flow diagram shows how data moves end-to-end from client to business analysts.
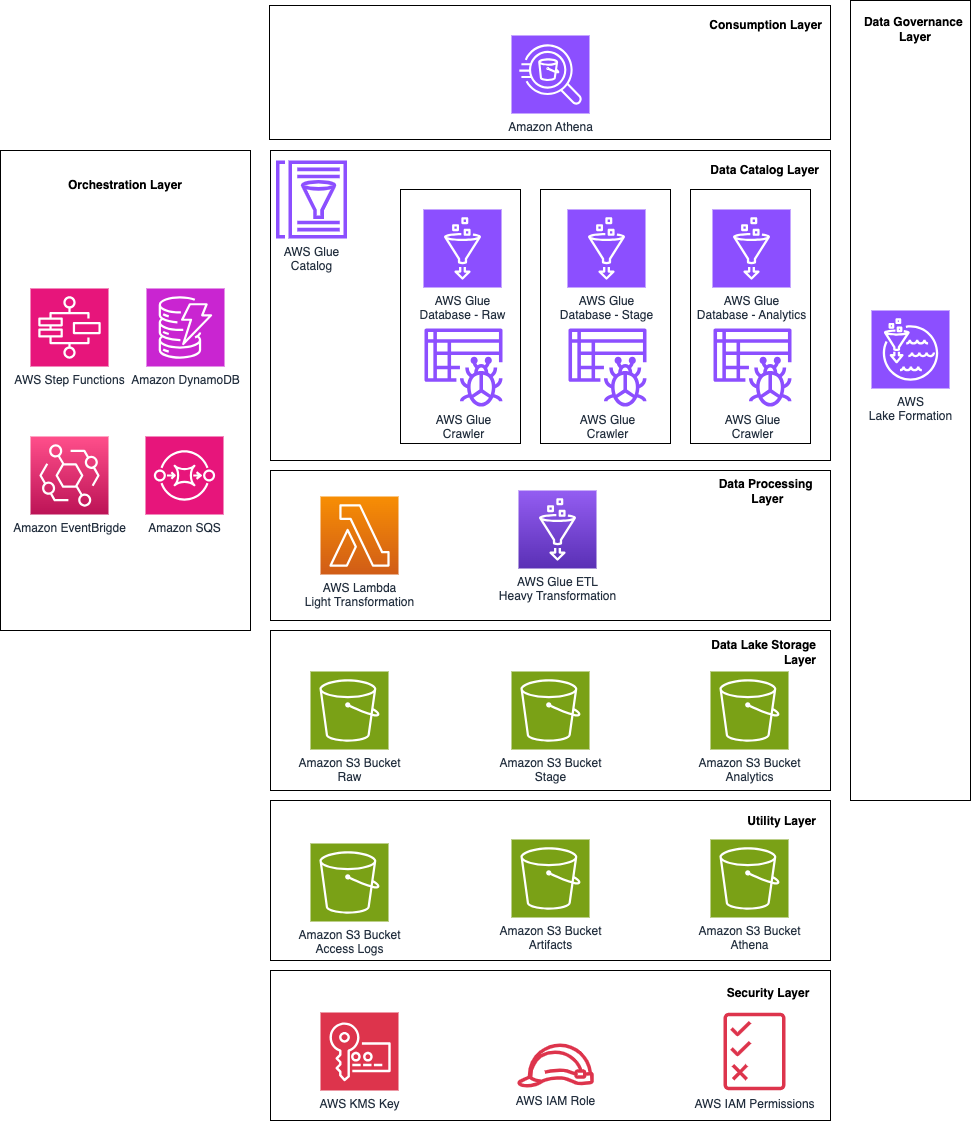
Architecture layers — each AWS service mapped to its functional responsibility
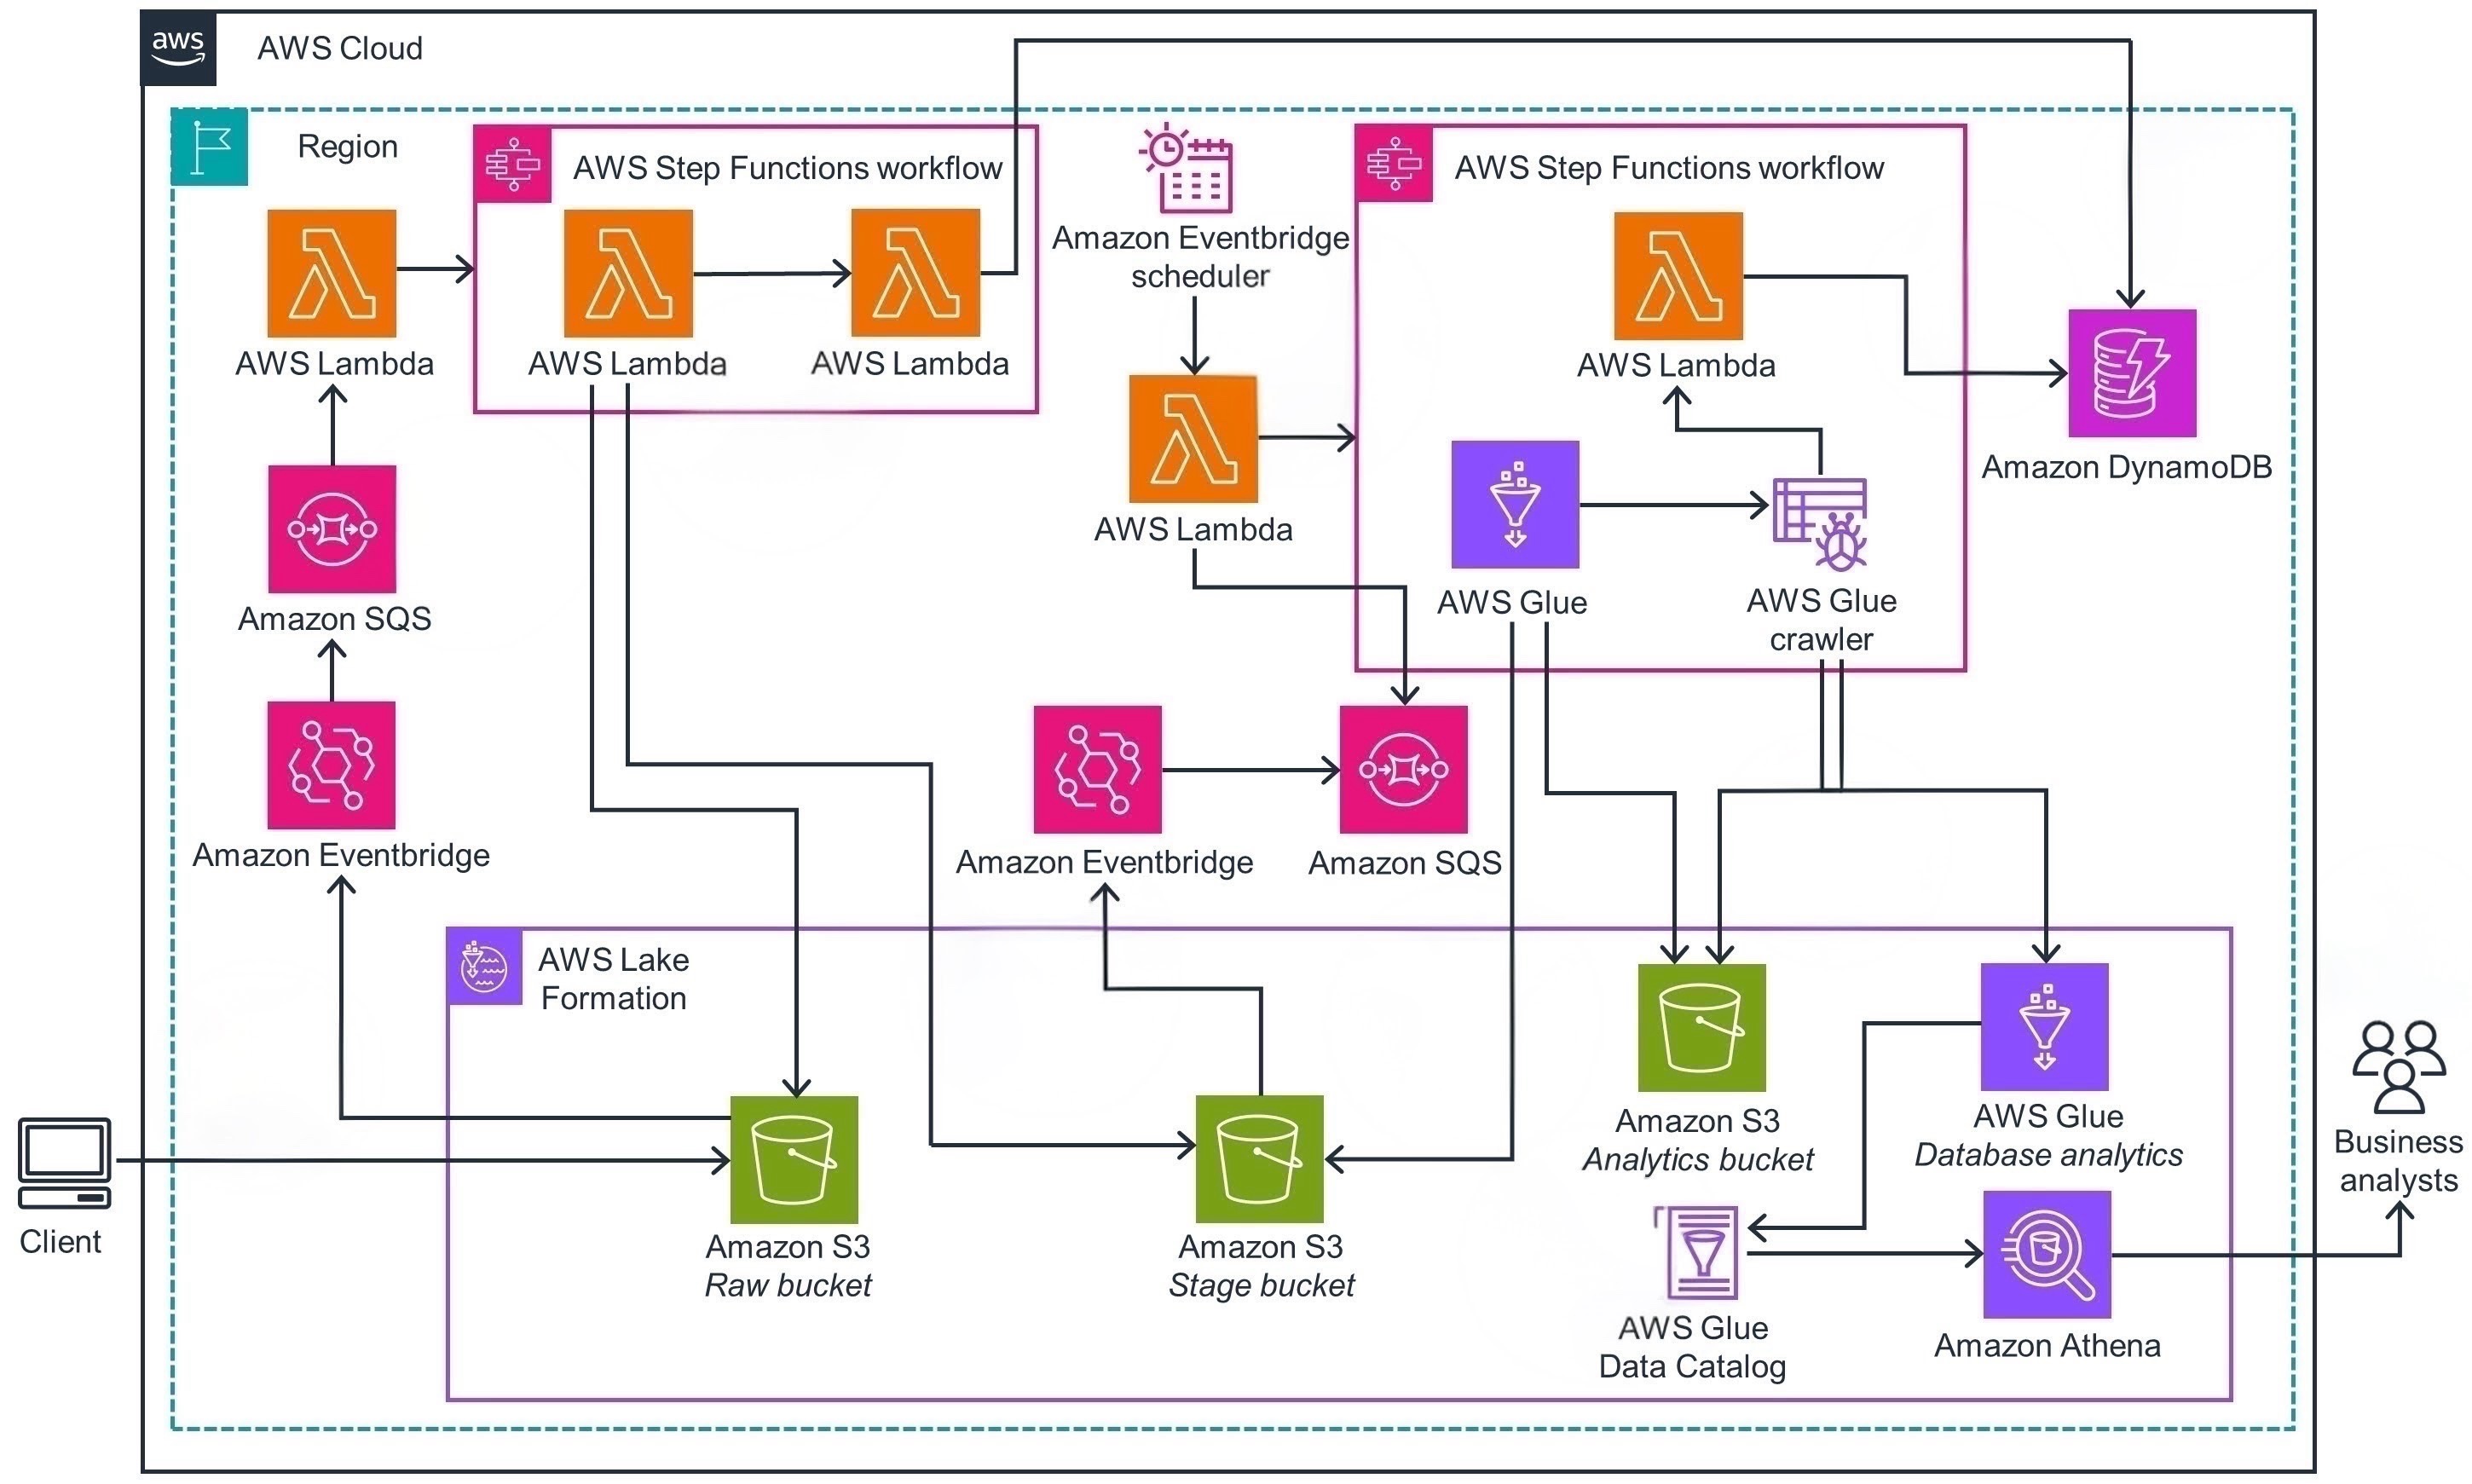
End-to-end data flow — from client ingestion to business analyst consumption
Orchestration: Step Functions State Machine
Each data load is orchestrated by an AWS Step Functions state machine. Every run is logged to DynamoDB on start and on completion — so there's always an audit trail of what ran, when, and what status it exited with. SNS handles notifications to the team on both success and failure paths.
The state machine was designed so that failures don't silently disappear — the failure branch is just as explicit as the success branch, and both write to the same audit log.

AWS Step Functions console — actual production state machine
Key Engineering Decisions
Why Parquet over CSV or JSON in the processed zone?
The source data arrives in mixed formats — XML from CEPI, CSV from MSDS, manual downloads from MISCHOOL. The raw zone preserves original formats exactly, which matters for traceability and reprocessing. The processed zone converts everything to Parquet. For Athena queries — which are always aggregations across large time ranges and district subsets — columnar storage is significantly faster and cheaper: Athena charges per byte scanned, so a query that reads two columns on a Parquet file doesn't pay for the other twenty. Partitioning by year and district compounds this.
Why AWS Lake Formation instead of S3 bucket policies alone?
Student data has strict access requirements — different district staff should see only their own district's records, and certain columns (PII, financial) should not be readable by all consumers. S3 bucket policies operate at the object level, which isn't granular enough. Lake Formation provides column-level and row-level filtering that sits above the storage layer and applies consistently whether the query comes from Athena, QuickSight, or an analyst's notebook. It also integrates with IAM and makes access audits straightforward.
Why Step Functions over Airflow or plain Lambda chaining?
The pipeline has branching logic — different source types go through different transformation paths, and failures need to be handled differently from successes. Airflow would have been overkill for an organization that doesn't already run it; maintaining an Airflow deployment adds infrastructure overhead that isn't justified here. Plain Lambda chaining is hard to visualize and debug when something goes wrong. Step Functions gives visual workflow state, built-in retry logic, and the ability to see exactly which state a failed execution stopped at — which matters for a small team that needs to diagnose issues quickly.
Outcome & Reflection
The 3-day-to-under-1-hour improvement was the headline metric, but the more meaningful change was that analysts stopped being the bottleneck. Before, every new question from leadership required a manual data pull. After, the data is always there — Athena-queryable, partitioned, governed — and new dashboards are a QuickSight configuration, not a three-day extraction task.
The hardest part of the project wasn't the AWS architecture — it was understanding what the data actually meant. CEPI, MSDS, and district SIS systems use overlapping identifiers and slightly different schema conventions for the same concepts (e.g., "enrollment date" means different things in different systems). The Glue DataBrew profiling step was where most of the real work happened: understanding the shape and quality of each source before writing a single join.