Overview
PlacesOps started as a compact BI prototype and evolved into a production-minded analytics product. The current version treats business metrics, data quality, documentation, platform health, and governed natural-language analysis as one product surface rather than separate artifacts.
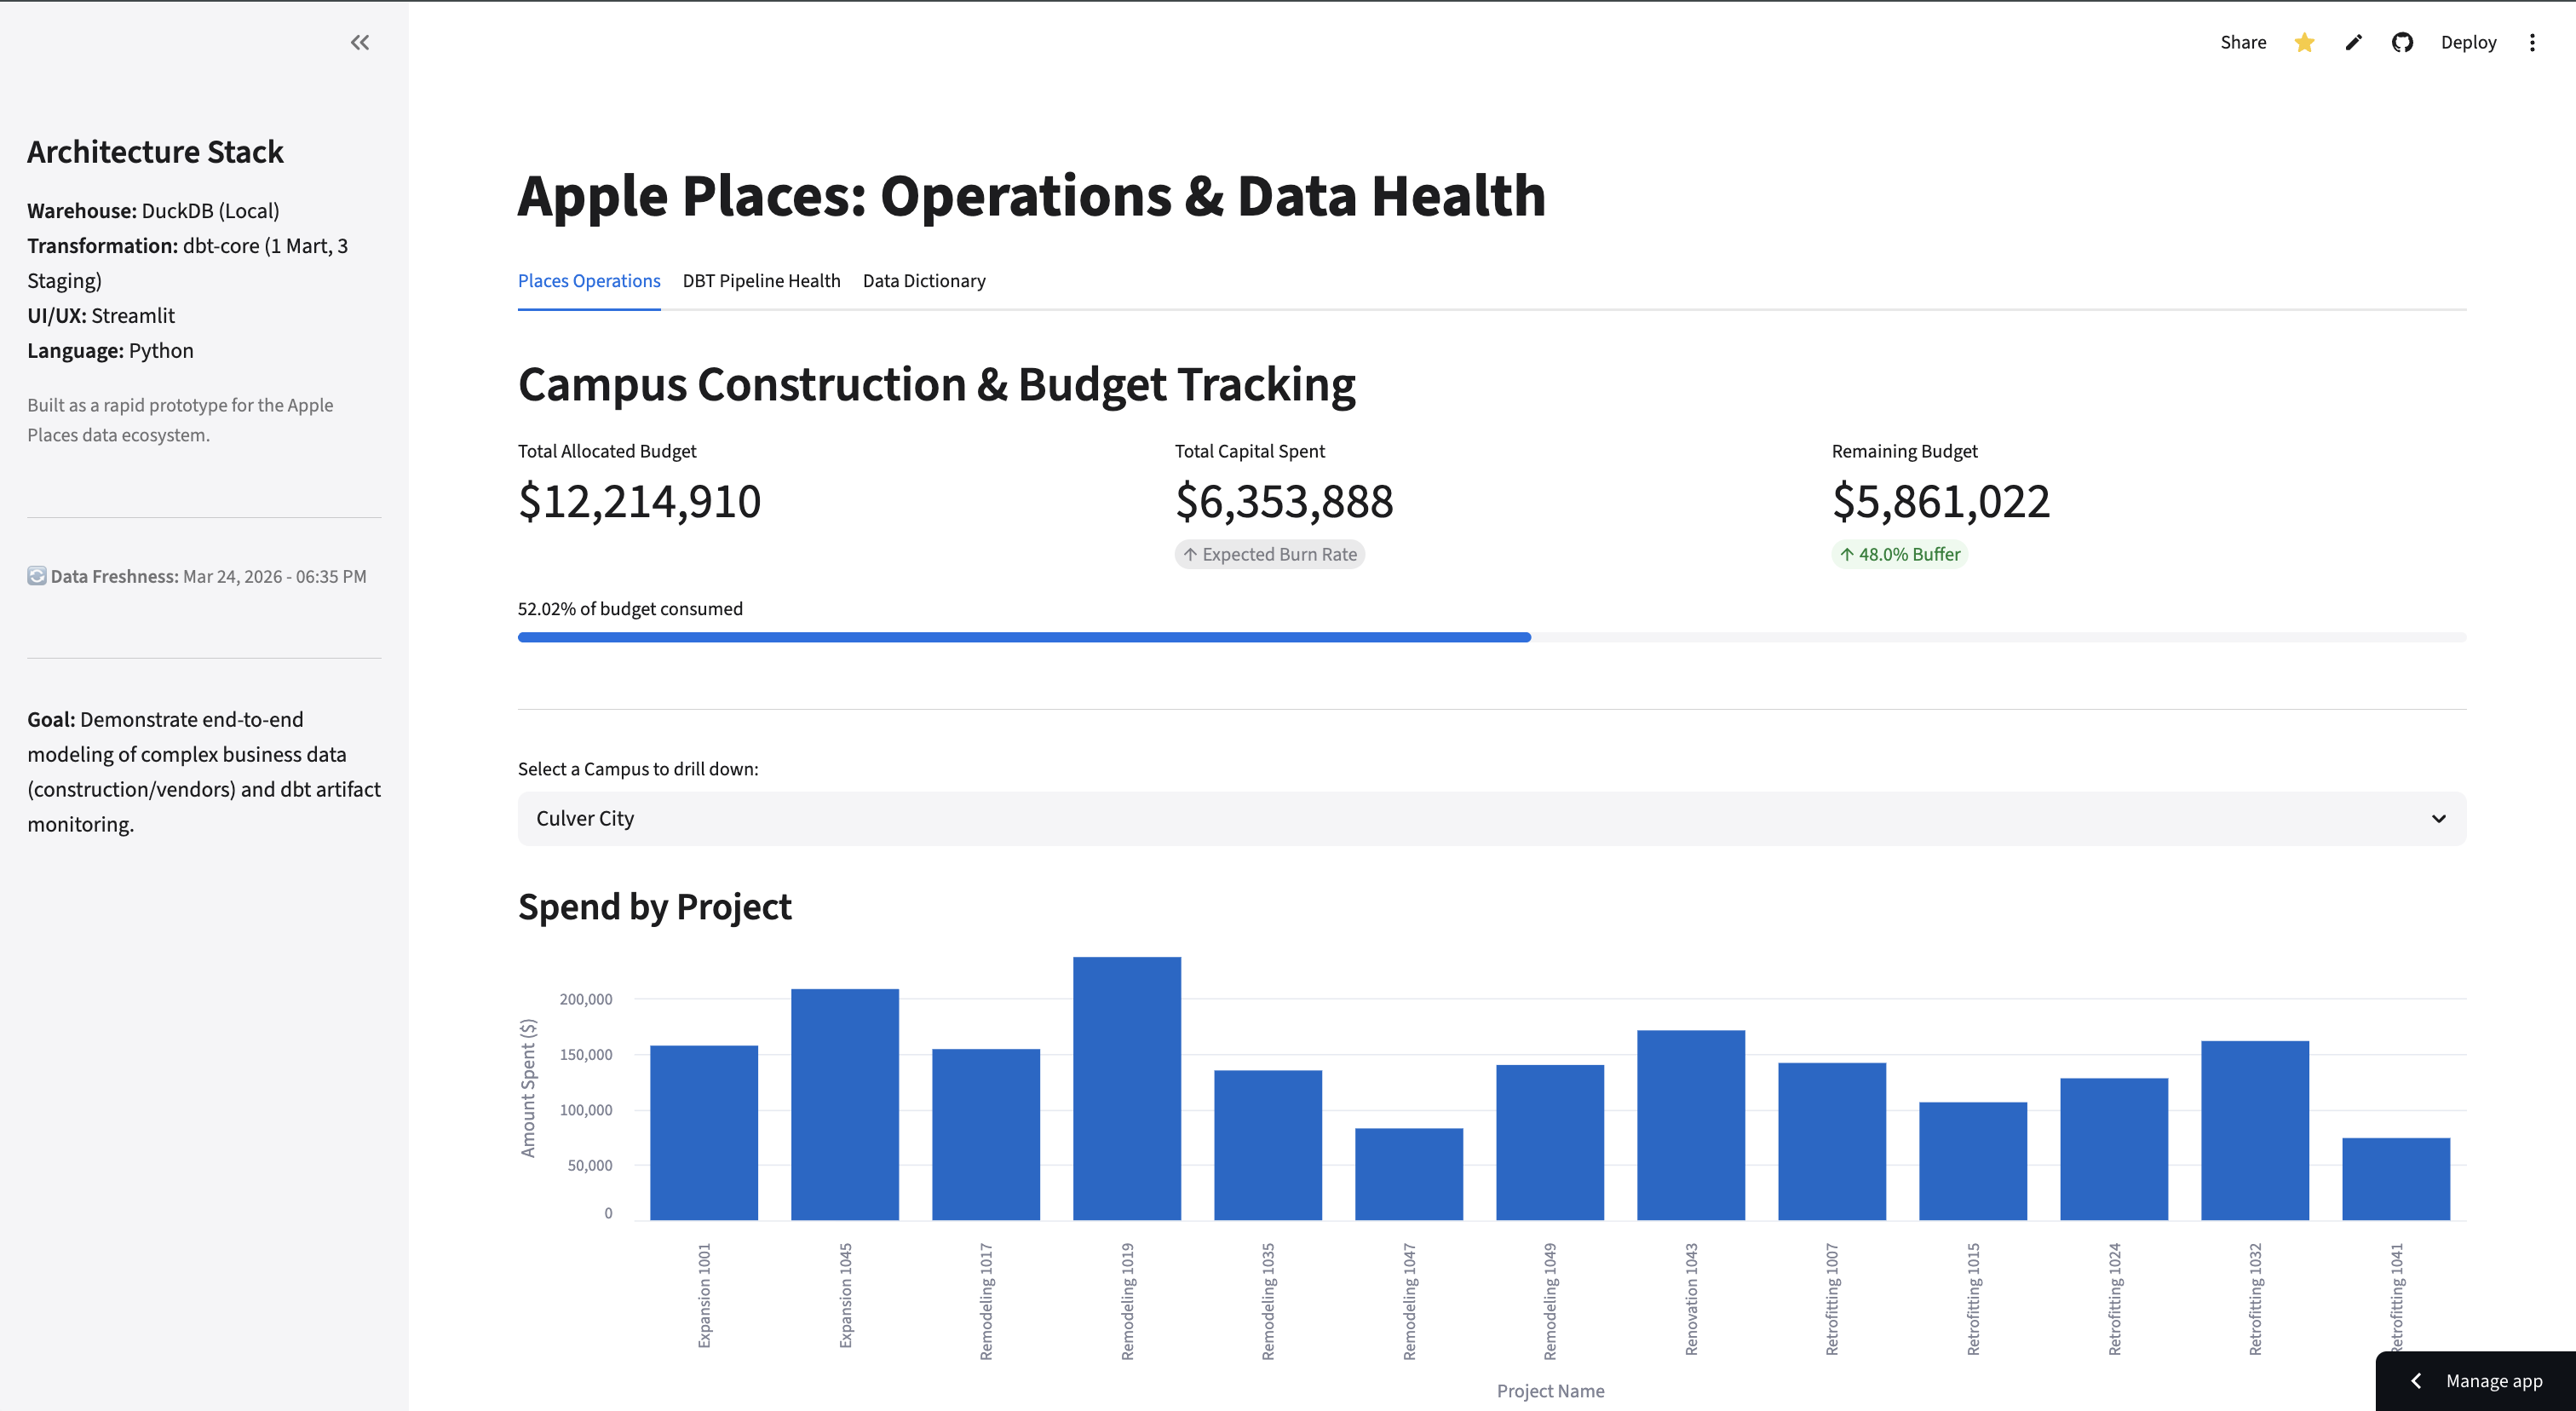
The app models generated construction, vendor, budget, and expense records into a trusted spend mart. Streamlit then serves five workflows: Executive Operations, Cost & Vendor Risk, Platform Health, Dictionary, and Insights Assistant. The same modeled data powers dashboard charts, metric definitions, dbt observability, and assistant answers.
Live Product
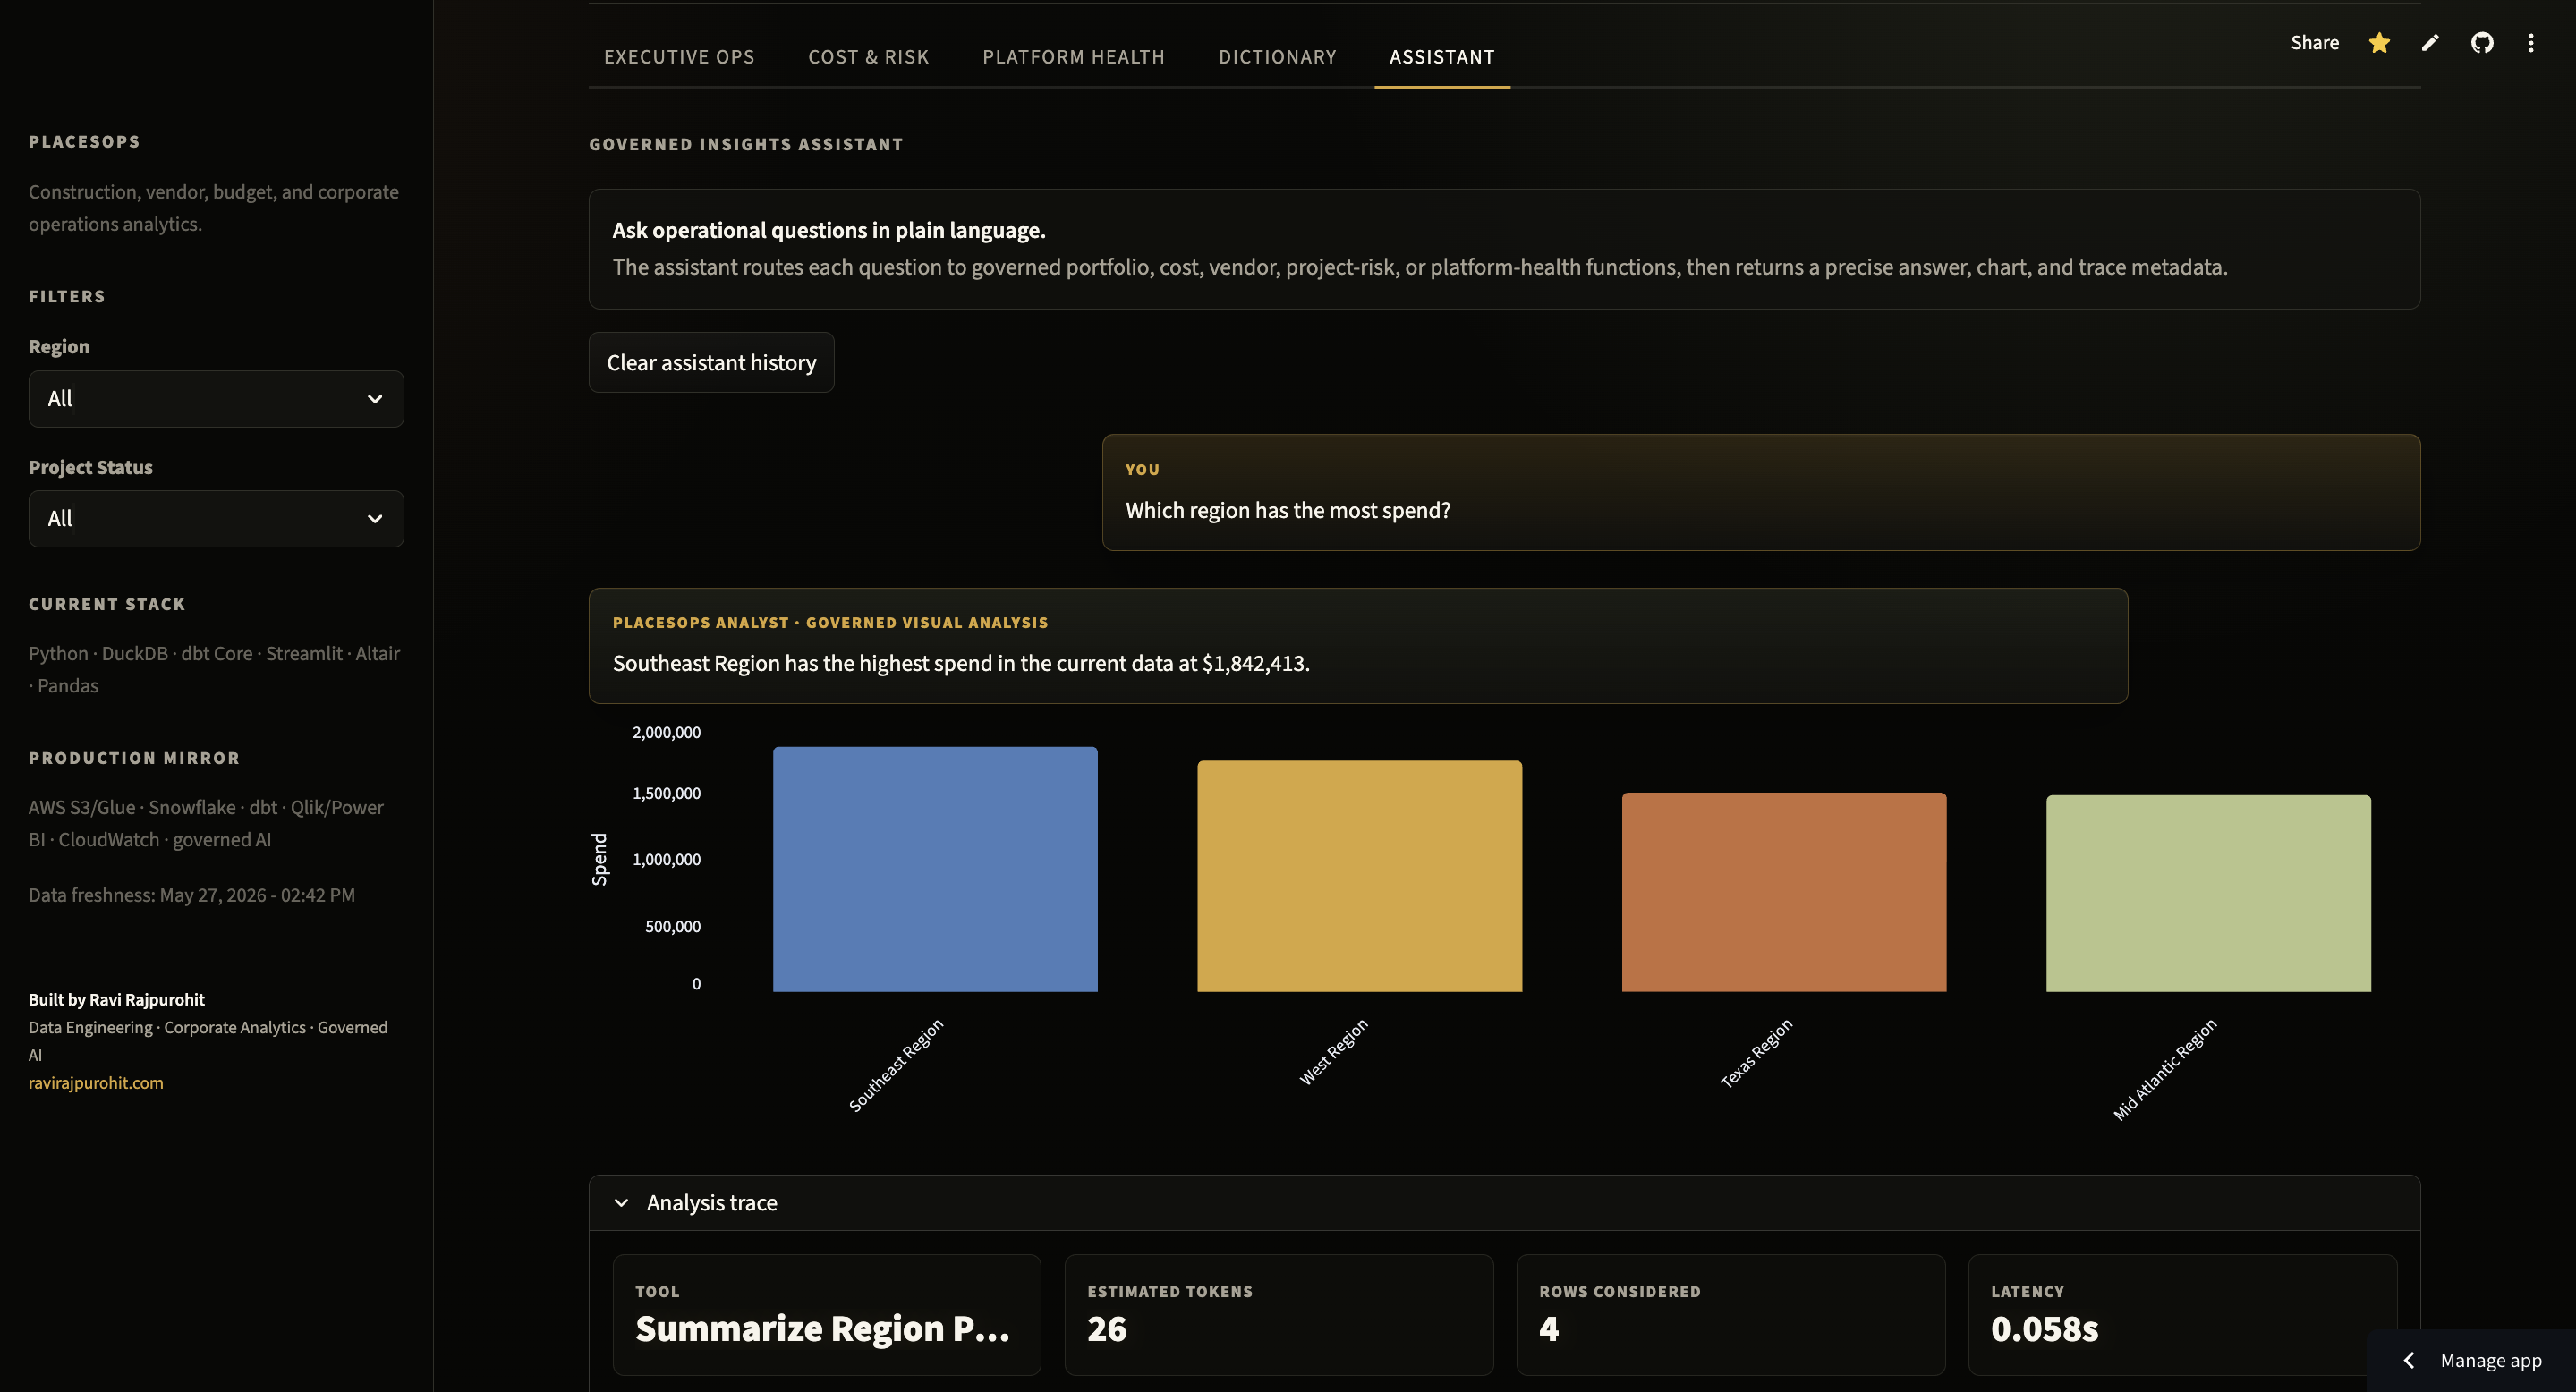
The public app is intentionally presented as an operations command center: executive metrics, filters, spend visuals, and governed readouts are visible in the same workflow. The assistant view extends that surface with natural-language questions, generated charts, and trace metadata.
System Architecture
The architecture mirrors a production analytics stack in a portable local form: generated operational sources flow through source-aligned dbt staging models, land in a DuckDB mart, and feed both business and engineering workflows.
flowchart LR
    A["Generated project records"] --> D["dbt staging models"]
    B["Generated vendor records"] --> D
    C["Generated expense records"] --> D
    D --> E["fct_project_spend\ntrusted spend mart"]
    E --> F["Executive Operations\nportfolio KPIs"]
    E --> G["Cost & Vendor Risk\ncategories and risk queues"]
    H["dbt run_results.json"] --> I["Platform Health\nmodel and test telemetry"]
    J["models/schema.yml"] --> K["Dictionary\nmetric and model docs"]
    E --> L["Insights Assistant\ngoverned visual analyst"]
    I --> L
    K --> L
Data Model
Three source domains feed one analytics-ready fact table. The grain stays expense-level, while project, region, status, vendor, reliability, budget, date, amount, and category attributes give the app enough context for executive KPIs, budget variance, delayed-project exposure, cost mix, and vendor reliability review.
erDiagram
    PROJECTS {
        string project_id PK
        string project_name
        string operating_region
        number budget_allocated
        string status
    }
    VENDORS {
        string vendor_id PK
        string vendor_name
        number reliability_score
    }
    EXPENSES {
        string expense_id PK
        string project_id FK
        string vendor_id FK
        date expense_date
        number amount
        string category
    }
    FCT_PROJECT_SPEND {
        string expense_id PK
        date expense_date
        number amount
        string category
        string project_name
        string operating_region
        string status
        number budget_allocated
        string vendor_name
        number reliability_score
    }
    PROJECTS ||--o{ EXPENSES : "receives"
    VENDORS ||--o{ EXPENSES : "paid_by"
    EXPENSES ||--|| FCT_PROJECT_SPEND : "modeled_into"
Delivery Progression
The project moved through three production-like phases: establish trustworthy data foundations, expand the dashboard into a governed data product, then harden the public product surface. The result reads as progressive delivery rather than a one-off prototype.
timeline
    title PlacesOps Development Lifecycle
    2026-05-24 : Established the analytics foundation
               : Generated privacy-safe project, vendor, budget, and expense sources
               : Modeled staging tables and the first project-spend mart in DuckDB
               : Added dbt tests and a baseline Streamlit operations dashboard
    2026-05-25 : Expanded from dashboard to governed data product
               : Split the app into executive, risk, platform-health, dictionary, and assistant workflows
               : Added budget variance, delayed exposure, vendor reliability, and assistant trace metadata
               : Reframed local artifacts as a migration path to Snowflake, dbt, BI, and observability
    2026-05-26 : Hardened the portfolio-ready product surface
               : Completed dark theme and production UI consistency pass
               : Embedded governed insight panels across stakeholder workflows
               : Expanded metric definitions, model documentation, and public case-study evidence
Key Engineering Decisions
Why keep business analytics, platform health, documentation, and assistant workflows together?
Operational analytics fails when teams trust a chart but cannot inspect freshness, quality, definitions, or lineage. Keeping all five workflows in one app makes the dashboard behave like a data product: business users see spend and risk, while data teams can verify the modeled assets and dbt run state behind those numbers.
Why use DuckDB and dbt instead of charting directly from CSVs?
The point of the project is not only to draw charts. DuckDB gives a fast local analytical warehouse, while dbt makes table grain, tests, documentation, and transformation ownership explicit. The same pattern maps cleanly to Snowflake and scheduled dbt jobs in production.
Why route natural-language questions to approved analytical functions?
A free-form SQL assistant is too easy to make impressive and too hard to trust. PlacesOps uses a deterministic router over approved business questions, modeled metrics, and metric definitions. The assistant can return text, charts, selected tool, token estimate, rows considered, latency, API call count, and cost without depending on external API quotas.
Why read model documentation from schema.yml?
The Dictionary workflow needs to stay current when definitions change. Reading from
schema.yml
keeps documentation close to the dbt models and avoids a stale hand-written dashboard
glossary. In production, the same idea would map to dbt docs, semantic definitions, and
governed BI metadata.
Outcome & Reflection
The strongest version of PlacesOps is no longer "a dashboard for project spend." It is a compact data product that demonstrates the full analytics loop: source shaping, warehouse modeling, data quality, documented metrics, platform visibility, dashboard workflows, and governed AI over trusted definitions.
In a production version, CSV sources would become ERP, finance, procurement, and project systems; DuckDB would become Snowflake; local dbt artifacts would become orchestration and observability telemetry; and Streamlit would map to Qlik, Power BI, or an internal analytics portal. The core pattern would remain the same: serve trustworthy metrics and the operational evidence behind them in the same place.